Note
Go to the end to download the full example code
5. SHAP Plots
This file shows interpretation of LGBMClassifier model using SHAP.
import pandas as pd
import numpy as np
import matplotlib.pyplot as plt

from shap import TreeExplainer
from shap import summary_plot

from utils import SAVE
from utils import CATEGORIES
from utils import LABEL_MAP
from utils import version_info
from utils import set_rcParams
from utils import make_data, return_train_test
from utils import get_no_gene_model
from utils import bar_pie
from utils import shap_scatter_plots
set_rcParams()
version_info()
python 3.7.17 (default, Jun 25 2023, 21:20:48)
[GCC 11.3.0]
os posix
ai4water 1.07
lightgbm 4.0.0
easy_mpl 0.21.4
SeqMetrics 1.3.4
tensorflow 1.15.0
tensorflow.python.keras.api._v1.keras 2.2.4-tf
numpy 1.19.5
pandas 1.3.5
matplotlib 3.5.3
h5py 2.10.0
sklearn 1.0.2
optuna 3.2.0
skopt 0.9.0
seaborn 0.12.2
shap 0.41.0
def make_classes(exp):
    colors = {'Physicochemical': '#006db6',
              'ARGs': '#f8aa59',
              'Antibiotics': '#b72c10'
              }

    classes = []
    colors_ = []
    for f in exp.feature_names:
        if f in CATEGORIES['Physicochemical']:
            classes.append('Physicochemical')
            colors_.append(colors['Physicochemical'])
        elif f in CATEGORIES['ARGs']:
            classes.append('ARGs')
            colors_.append(colors['ARGs'])
        elif f in CATEGORIES['Antibiotics']:
            classes.append('Antibiotics')
            colors_.append(colors['Antibiotics'])
        else:
            raise ValueError

    return classes, colors_
MCR-1
target = 'MCR-1'

TrainX, TrainY, TestX, TestY, inputs, encoders = return_train_test(target, 'no_genes', return_encoders=True)

model = get_no_gene_model(target, True, 'LGBMClassifier')

cols = TrainX.columns.tolist()
TrainX = pd.DataFrame(model._transform_x(TrainX), columns=cols)

# Create a SHAP explainer
explainer = TreeExplainer(model._model, TrainX,
                          feature_names=TrainX.columns)

# Calculate the SHAP values for the test set
shap_values = explainer.shap_values(TestX, TestY)
A column-vector y was passed when a 1d array was expected. Please change the shape of y to (n_samples, ), for example using ravel().
summary plot
summary_plot(shap_values,
         TestX,
         max_display=34,
    feature_names=[LABEL_MAP[n] if n in LABEL_MAP else n for n in TrainX.columns],
             show=False,
             class_names=['yes', 'no'])
if SAVE:
    plt.savefig(f"results/figures/shap_summary_{target}.png", dpi=600, bbox_inches="tight")
plt.tight_layout()
plt.show()

findfont: Font family ['Times New Roman'] not found. Falling back to DejaVu Sans.
findfont: Font family ['Times New Roman'] not found. Falling back to DejaVu Sans.
findfont: Font family ['Times New Roman'] not found. Falling back to DejaVu Sans.
findfont: Font family ['Times New Roman'] not found. Falling back to DejaVu Sans.
bar chart
sv_bar = np.mean(np.abs(shap_values), axis=0)

classes, colors_ = make_classes(explainer)

df_with_classes = pd.DataFrame(
    {'features': explainer.feature_names,
     'classes': classes,
     'mean_shap': sv_bar,
     'colors': colors_
     })

print(df_with_classes)


bar_pie(df_with_classes,
         save=SAVE,
         name=f"{target}",
        show=True)
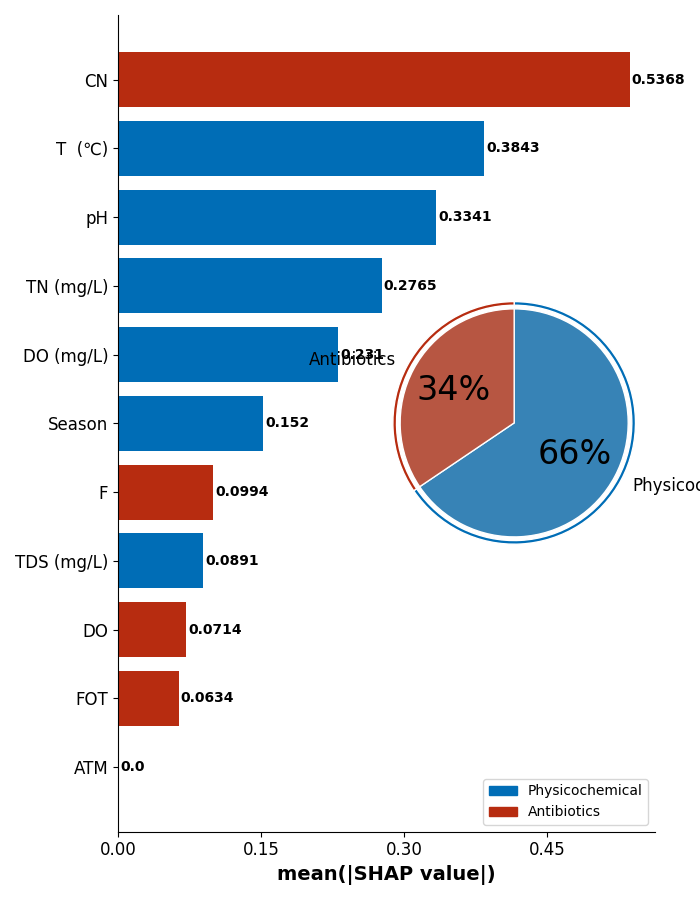
      features          classes  mean_shap   colors
0       season  Physicochemical   0.151985  #006db6
1       T  (℃)  Physicochemical   0.384293  #006db6
2           pH  Physicochemical   0.334055  #006db6
3   TDS (mg/L)  Physicochemical   0.089065  #006db6
4    DO (mg/L)  Physicochemical   0.231042  #006db6
5    TN (mg/L)  Physicochemical   0.276465  #006db6
6            F      Antibiotics   0.099440  #b72c10
7           DO      Antibiotics   0.071424  #b72c10
8           CN      Antibiotics   0.536769  #b72c10
9          ATM      Antibiotics   0.000000  #b72c10
10         FOT      Antibiotics   0.063415  #b72c10
This figure includes Axes that are not compatible with tight_layout, so results might be incorrect.
findfont: Font family ['Times New Roman'] not found. Falling back to DejaVu Sans.
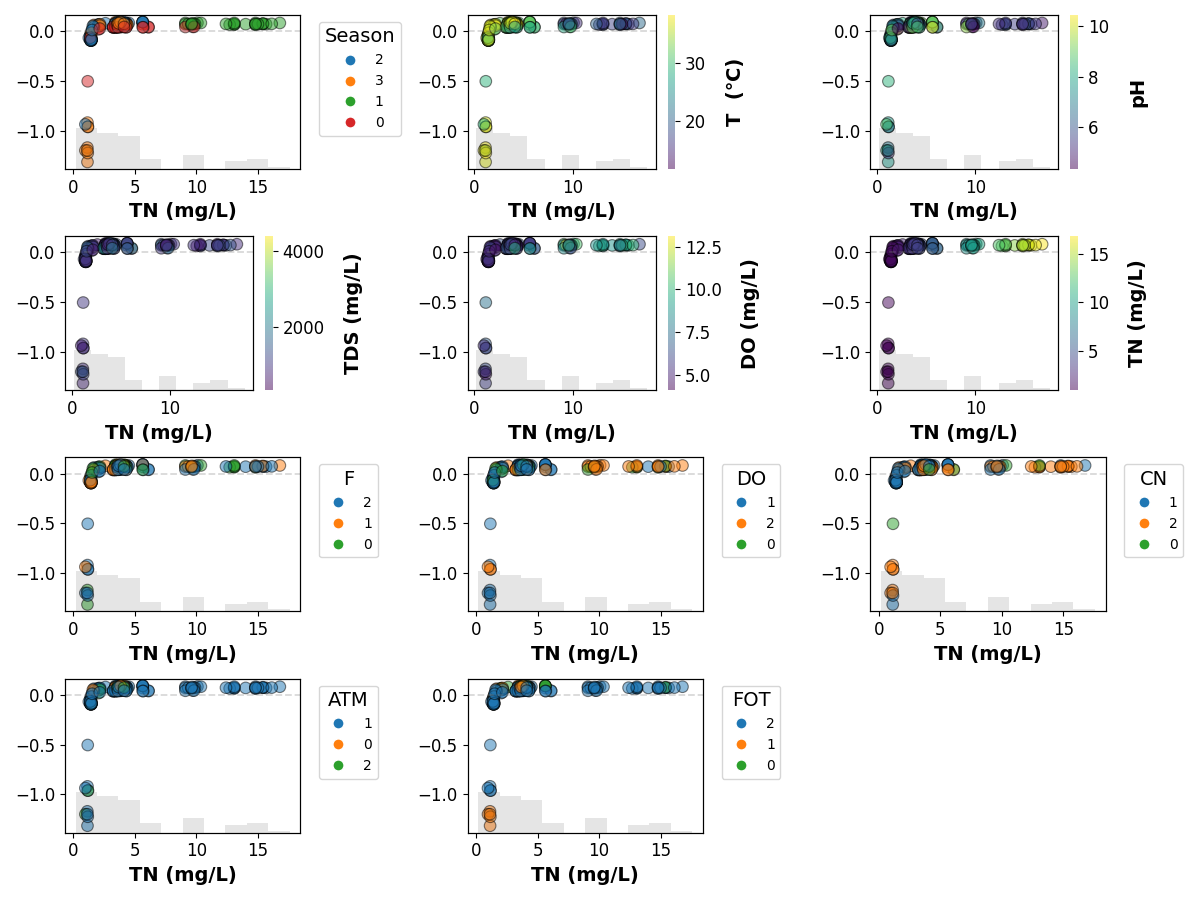
scatter plot
feature = 'season'
if feature in TrainX:
    shap_scatter_plots(
        shap_values,
        TestX,
        feature_name=feature,
        encoders=encoders,
        save=SAVE,
        name=target)

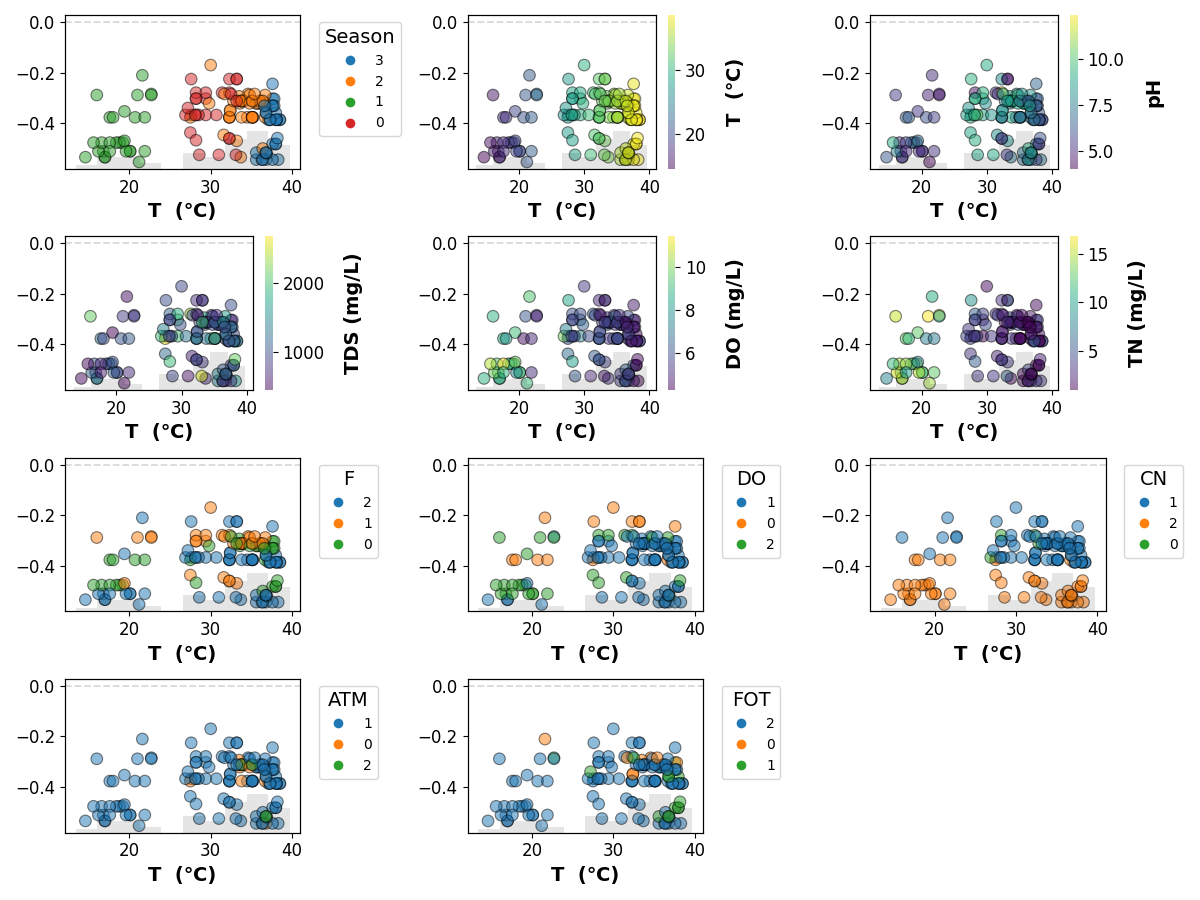
feature = 'T  (℃)'
if feature in TrainX:
    shap_scatter_plots(
        shap_values,
        TestX,
        feature_name=feature,
        encoders=encoders,
        save=SAVE,
        name=target)
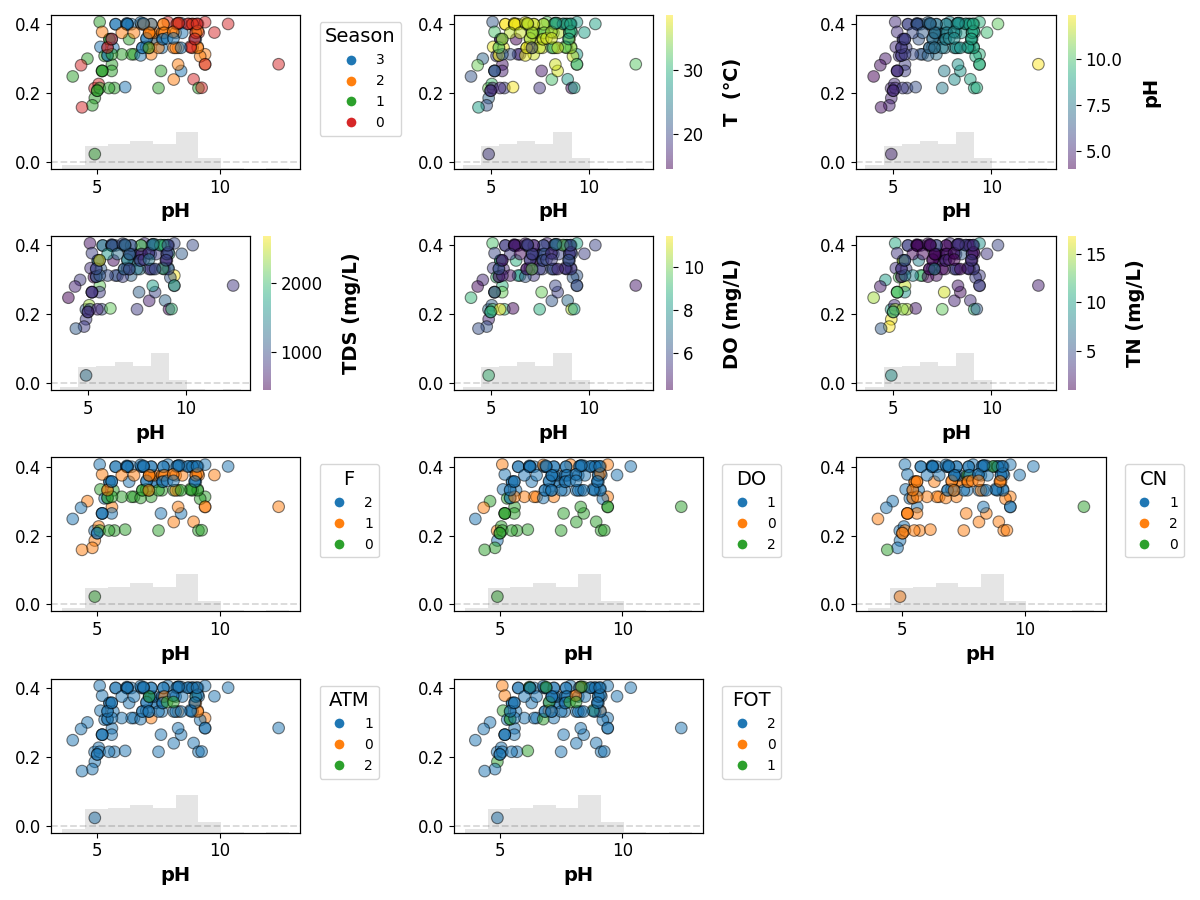
feature = 'pH'
if feature in TrainX:
    shap_scatter_plots(
        shap_values,
        TestX,
        feature_name=feature,
        encoders=encoders,
        save=SAVE,
        name=target)
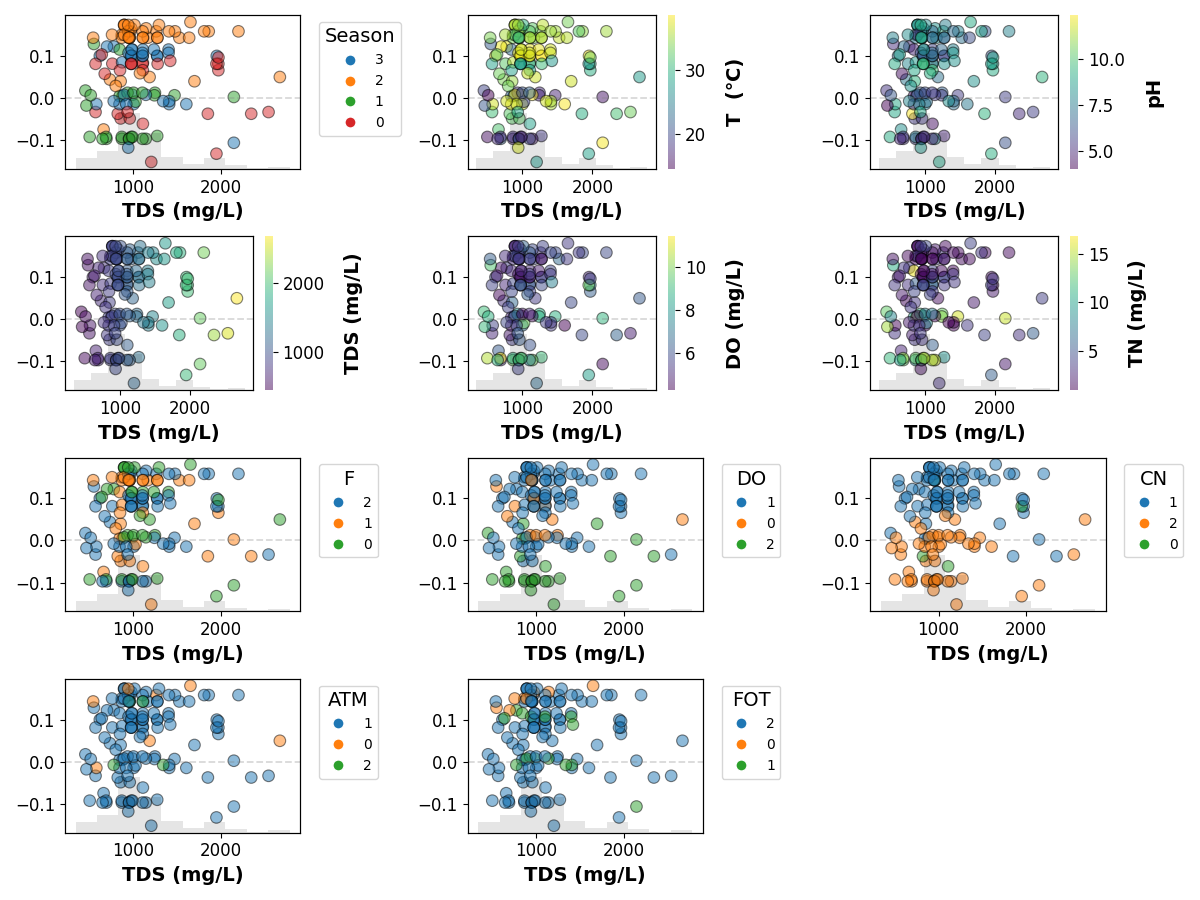
feature = 'TDS (mg/L)'
if feature in TrainX:
    shap_scatter_plots(
        shap_values,
        TestX,
        feature_name=feature,
        encoders=encoders,
        save=SAVE,
        name=target)
feature = 'DO (mg/L)'
if feature in TrainX:
    shap_scatter_plots(
        shap_values,
        TestX,
        feature_name=feature,
        encoders=encoders,
        save=SAVE,
        name=target)

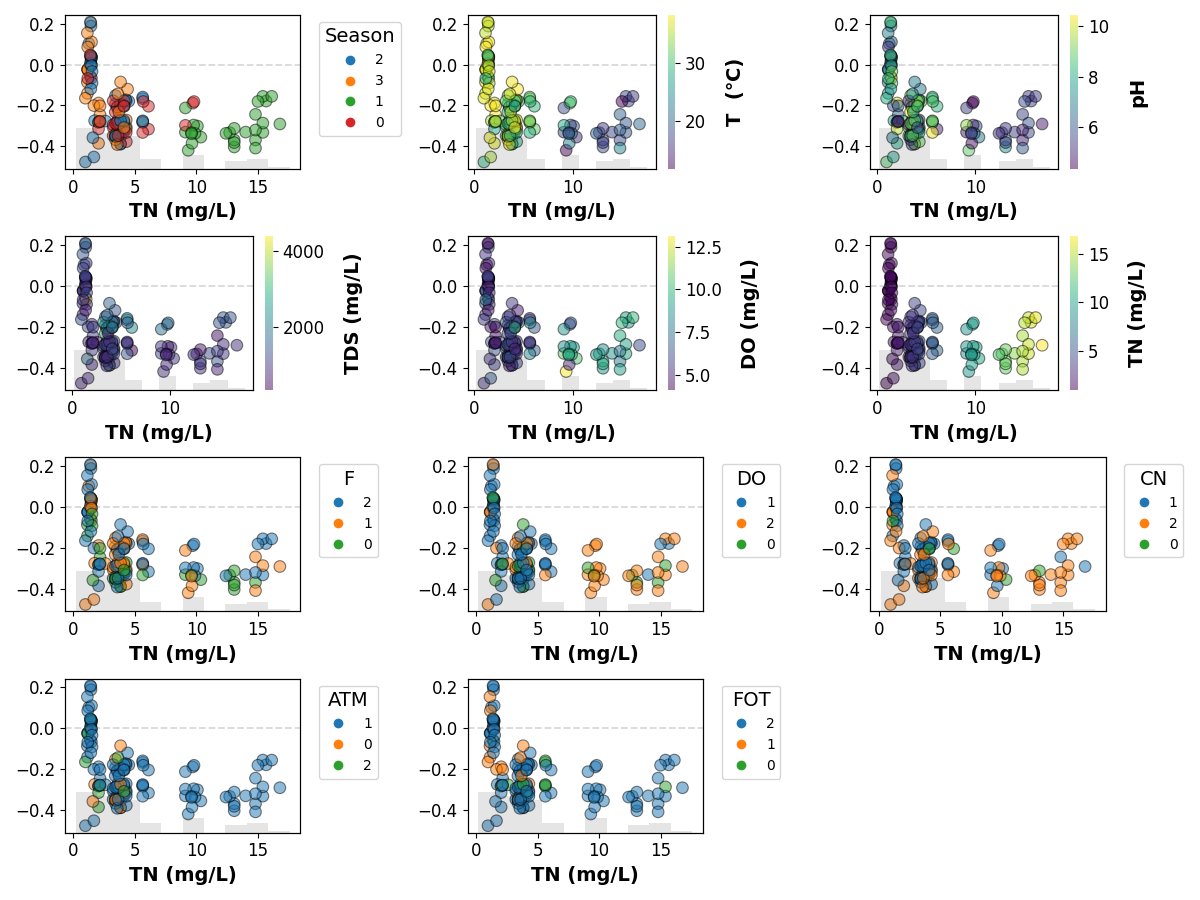
feature = 'TN (mg/L)'
if feature in TrainX:
    shap_scatter_plots(
        shap_values,
        TestX,
        feature_name=feature,
        encoders=encoders,
        save=SAVE,
        name=target)
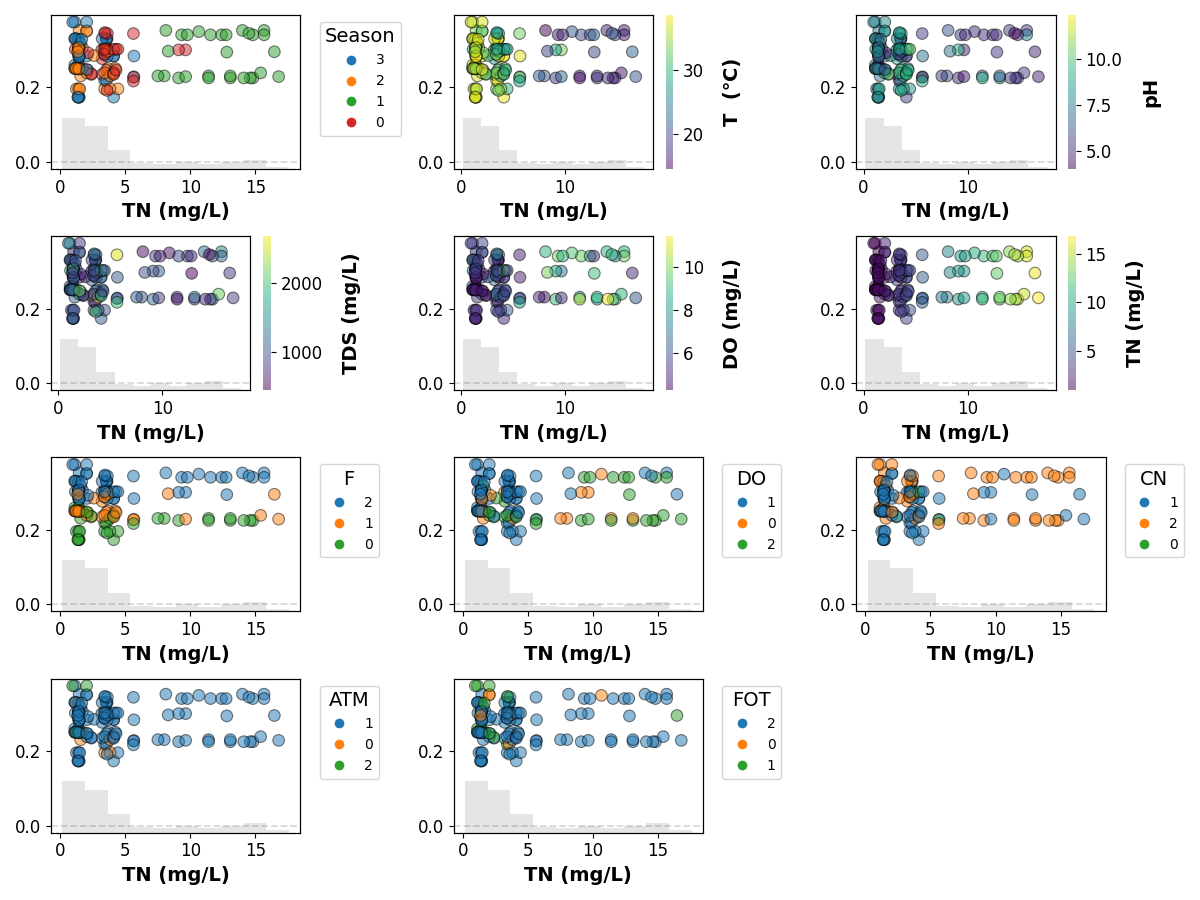
OXA48
target = 'OXA48'

TrainX, TrainY, TestX, TestY, inputs = return_train_test(target, 'no_genes')

model = get_no_gene_model(target, True, 'LGBMClassifier')

cols = TrainX.columns.tolist()
TrainX = pd.DataFrame(model._transform_x(TrainX), columns=cols)
#TestX = pd.DataFrame(model._transform_x(TestX), columns=cols)

# Create a SHAP explainer
explainer = TreeExplainer(model._model, TrainX,
                          feature_names=TrainX.columns)

# Calculate the SHAP values for the test set
shap_values = explainer.shap_values(TestX, TestY)
A column-vector y was passed when a 1d array was expected. Please change the shape of y to (n_samples, ), for example using ravel().
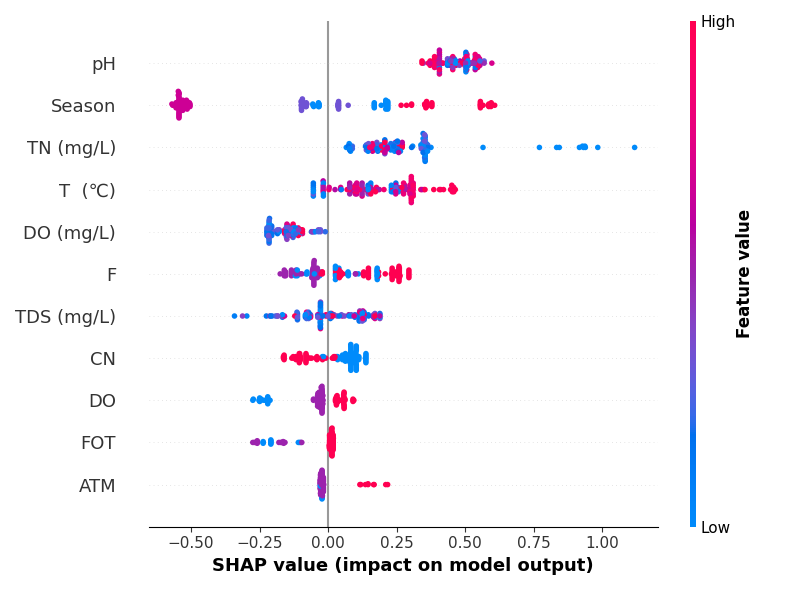
summary plot
summary_plot(shap_values,
         TestX,
         max_display=34,
    feature_names=[LABEL_MAP[n] if n in LABEL_MAP else n for n in TrainX.columns],
             show=False,
             class_names=['yes', 'no'])
if SAVE:
    plt.savefig(f"results/figures/shap_summary_{target}.png", dpi=600, bbox_inches="tight")
plt.tight_layout()
plt.show()
bar chart
sv_bar = np.mean(np.abs(shap_values), axis=0)

classes, colors_ = make_classes(explainer)

df_with_classes = pd.DataFrame(
    {'features': explainer.feature_names,
     'classes': classes,
     'mean_shap': sv_bar,
     'colors': colors_
     })

print(df_with_classes)


bar_pie(df_with_classes,
         save=SAVE,
         name=f"{target}",
        show=True)
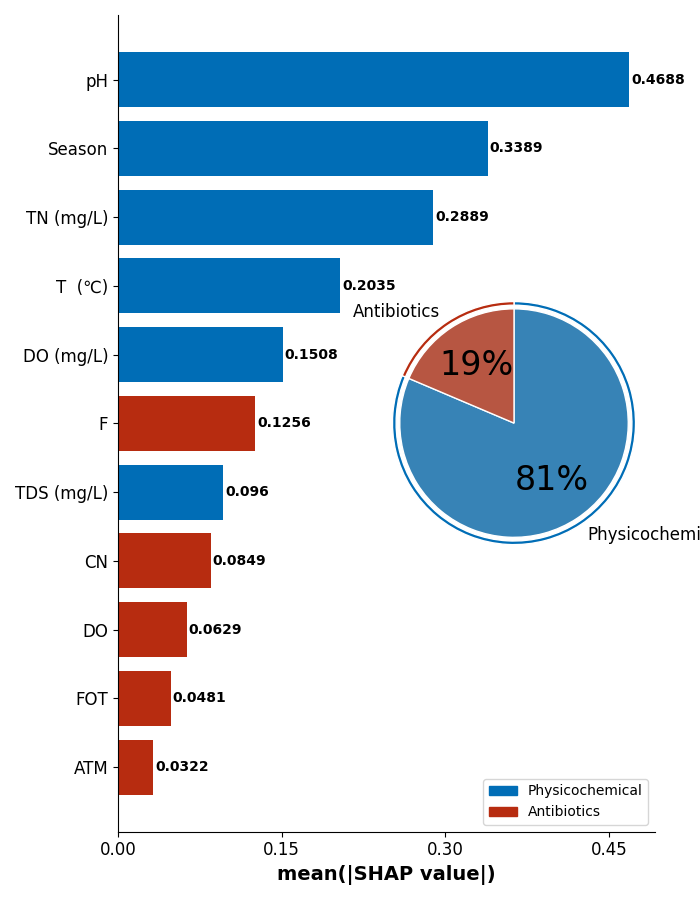
      features          classes  mean_shap   colors
0       season  Physicochemical   0.338874  #006db6
1       T  (℃)  Physicochemical   0.203547  #006db6
2           pH  Physicochemical   0.468801  #006db6
3   TDS (mg/L)  Physicochemical   0.095988  #006db6
4    DO (mg/L)  Physicochemical   0.150807  #006db6
5    TN (mg/L)  Physicochemical   0.288855  #006db6
6            F      Antibiotics   0.125600  #b72c10
7           DO      Antibiotics   0.062906  #b72c10
8           CN      Antibiotics   0.084851  #b72c10
9          ATM      Antibiotics   0.032195  #b72c10
10         FOT      Antibiotics   0.048084  #b72c10
This figure includes Axes that are not compatible with tight_layout, so results might be incorrect.
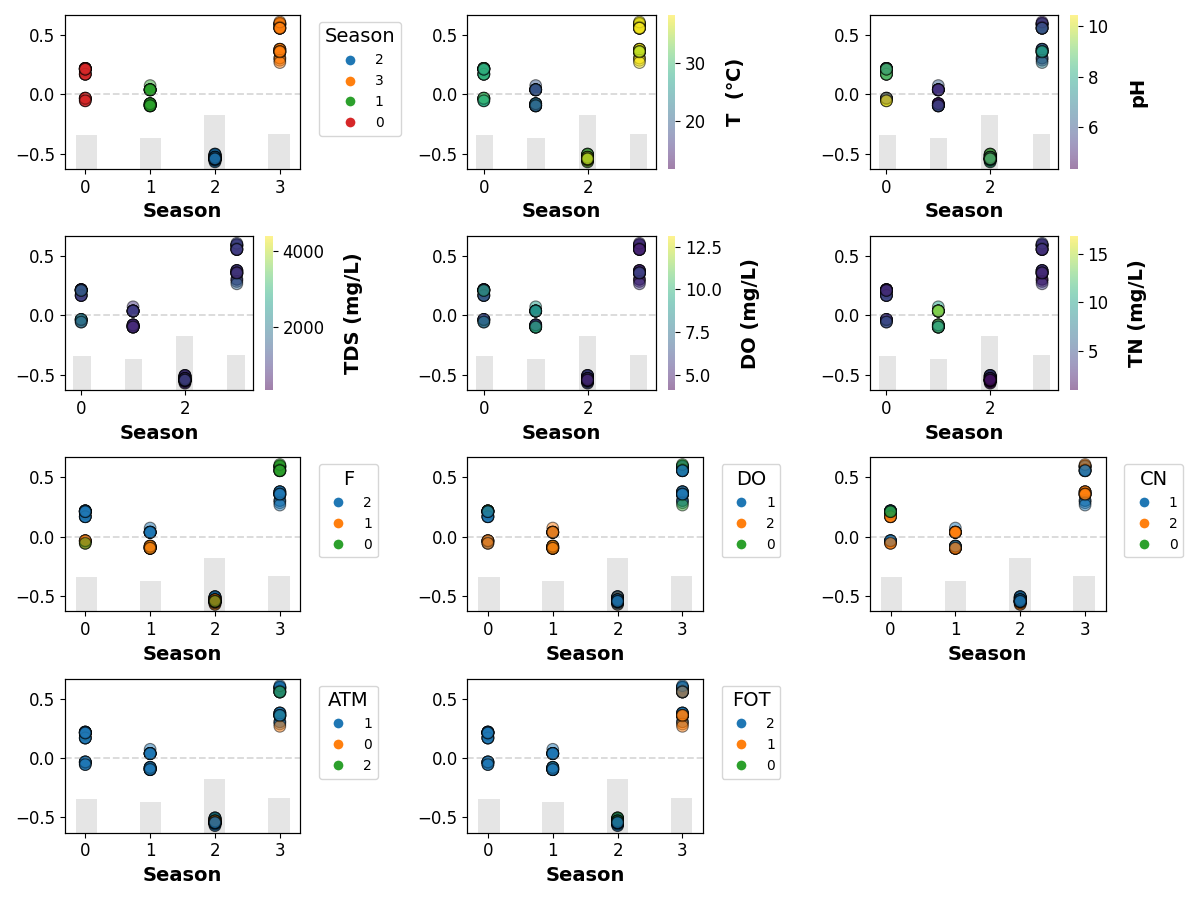
scatter plot
feature = 'season'
if feature in TrainX:
    shap_scatter_plots(
        shap_values,
        TestX,
        feature_name=feature,
        encoders=encoders,
        save=SAVE,
        name=target)
feature = 'T  (℃)'
if feature in TrainX:
    shap_scatter_plots(
        shap_values,
        TestX,
        feature_name=feature,
        encoders=encoders,
        save=SAVE,
        name=target)
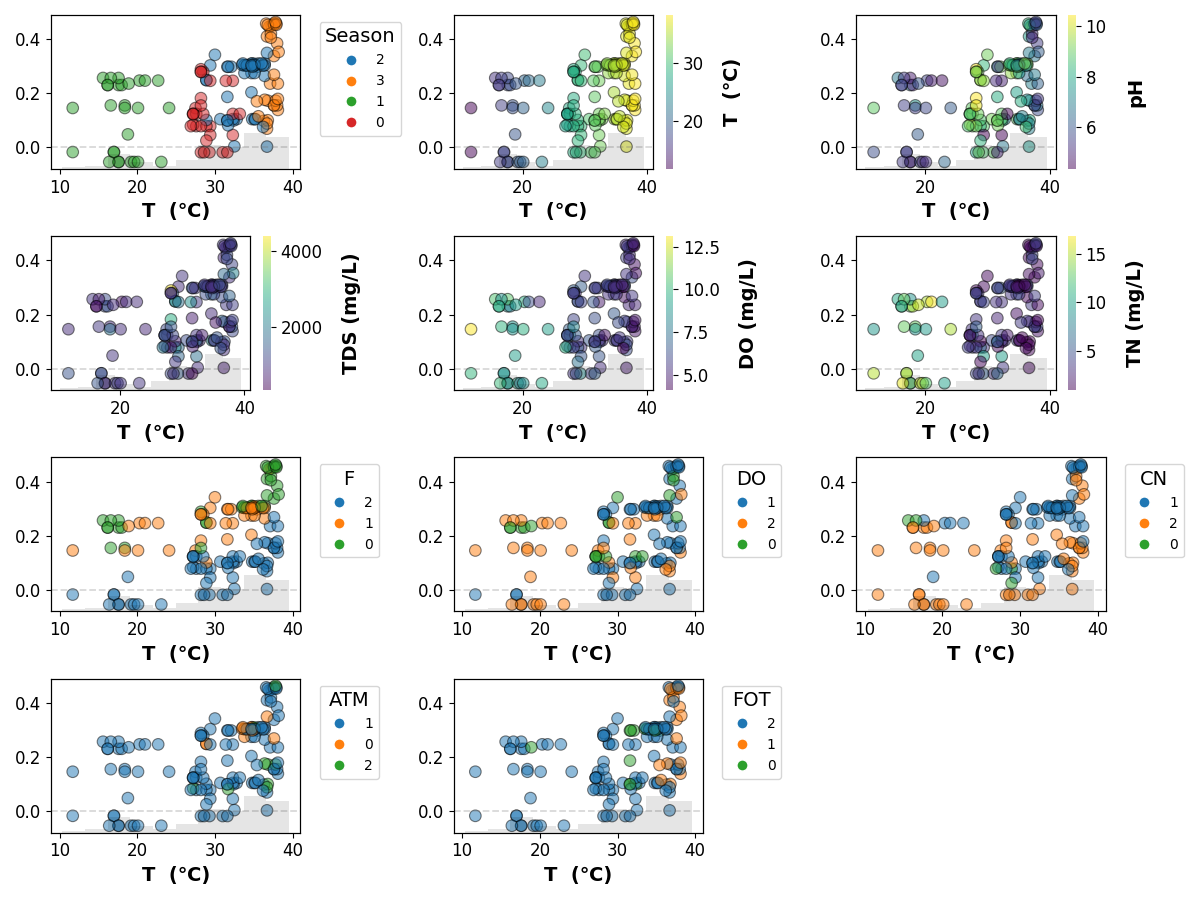
feature = 'pH'
if feature in TrainX:
    shap_scatter_plots(
        shap_values,
        TestX,
        feature_name=feature,
        encoders=encoders,
        save=SAVE,
        name=target)
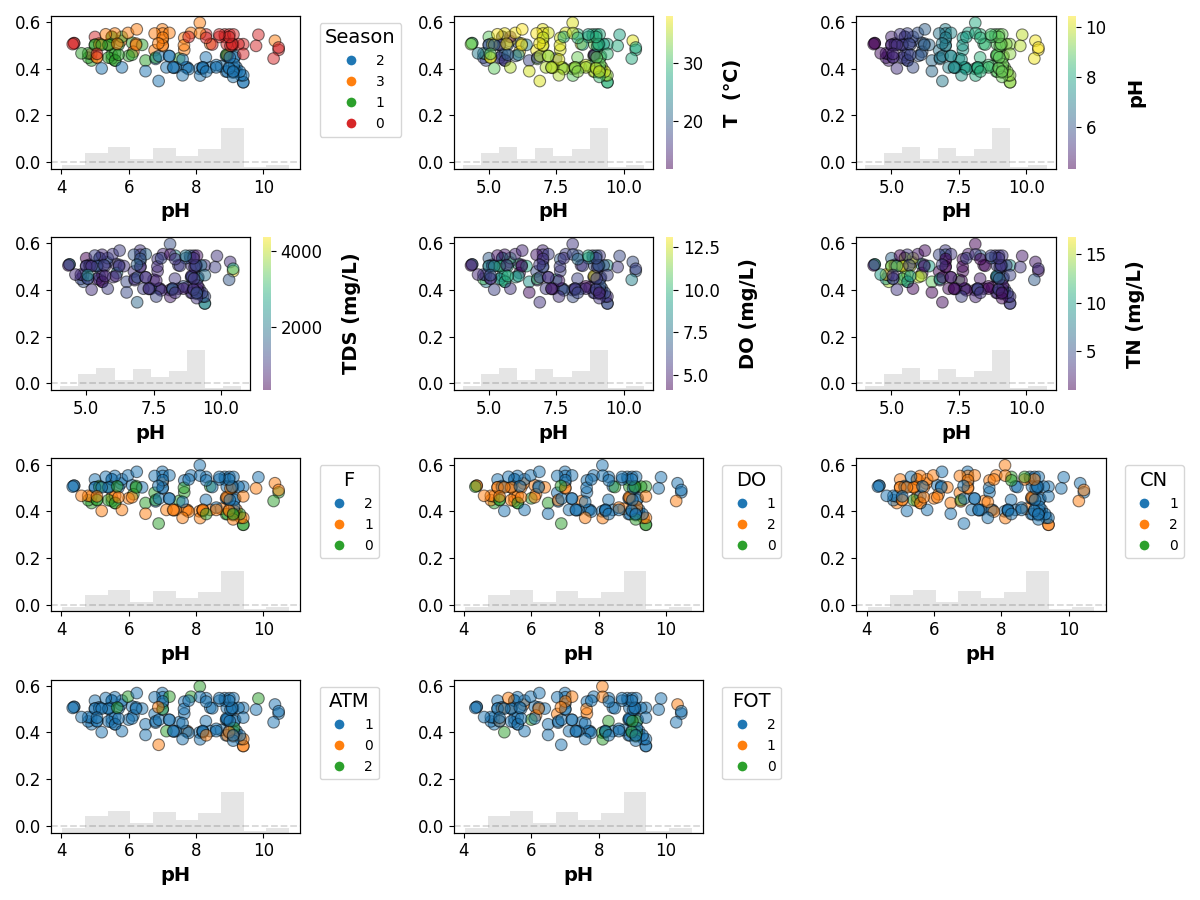
feature = 'TDS (mg/L)'
if feature in TrainX:
    shap_scatter_plots(
        shap_values,
        TestX,
        feature_name=feature,
        encoders=encoders,
        save=SAVE,
        name=target)
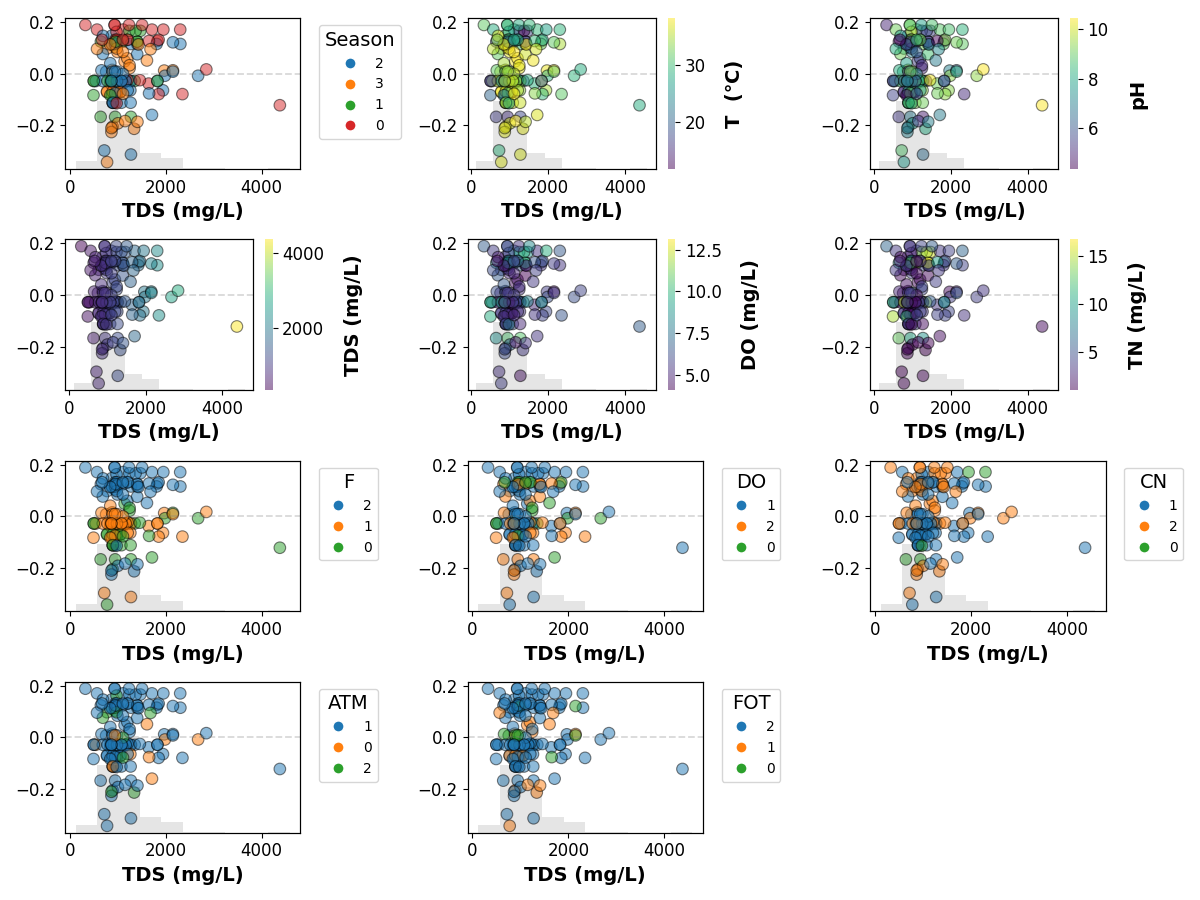
feature = 'DO (mg/L)'
if feature in TrainX:
    shap_scatter_plots(
        shap_values,
        TestX,
        feature_name=feature,
        encoders=encoders,
        save=SAVE,
        name=target)
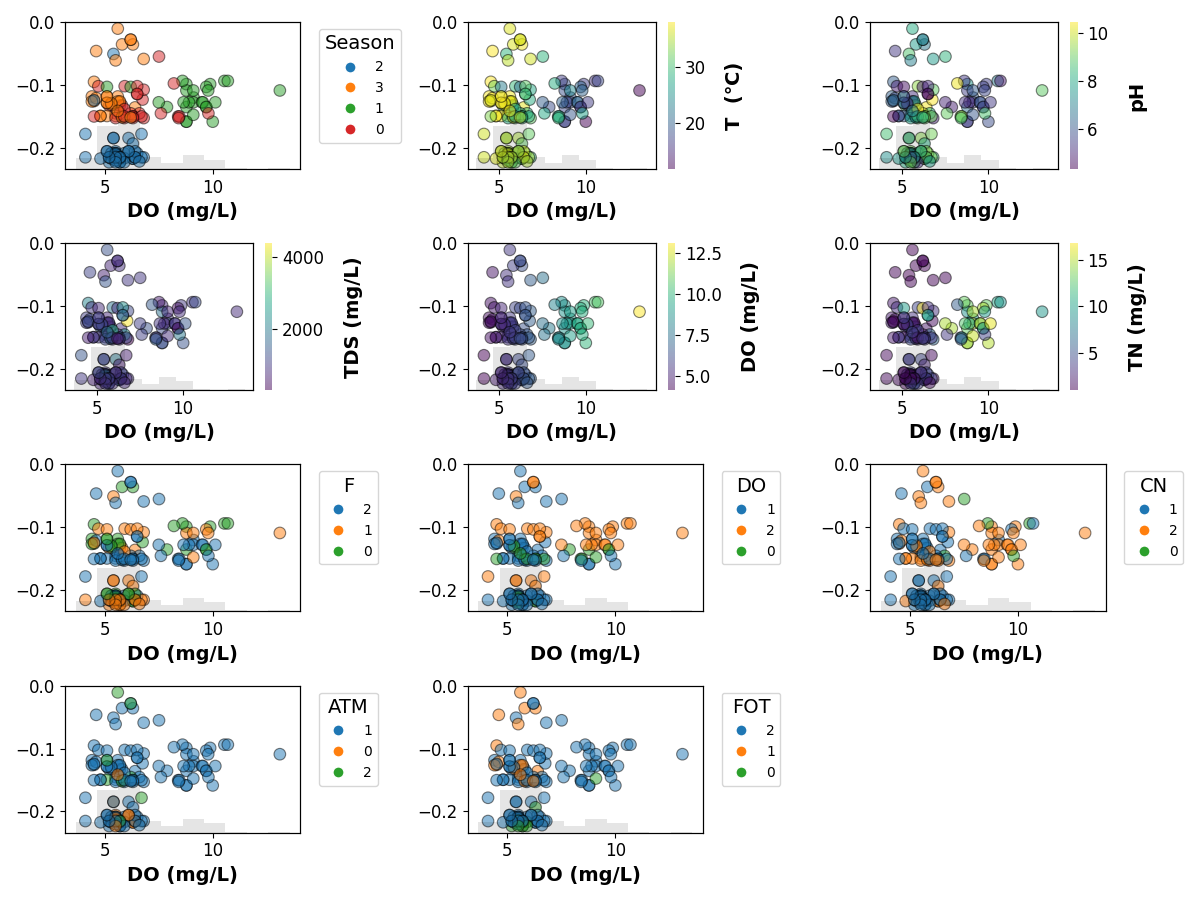
feature = 'TN (mg/L)'
if feature in TrainX:
    shap_scatter_plots(
        shap_values,
        TestX,
        feature_name=feature,
        encoders=encoders,
        save=SAVE,
        name=target)
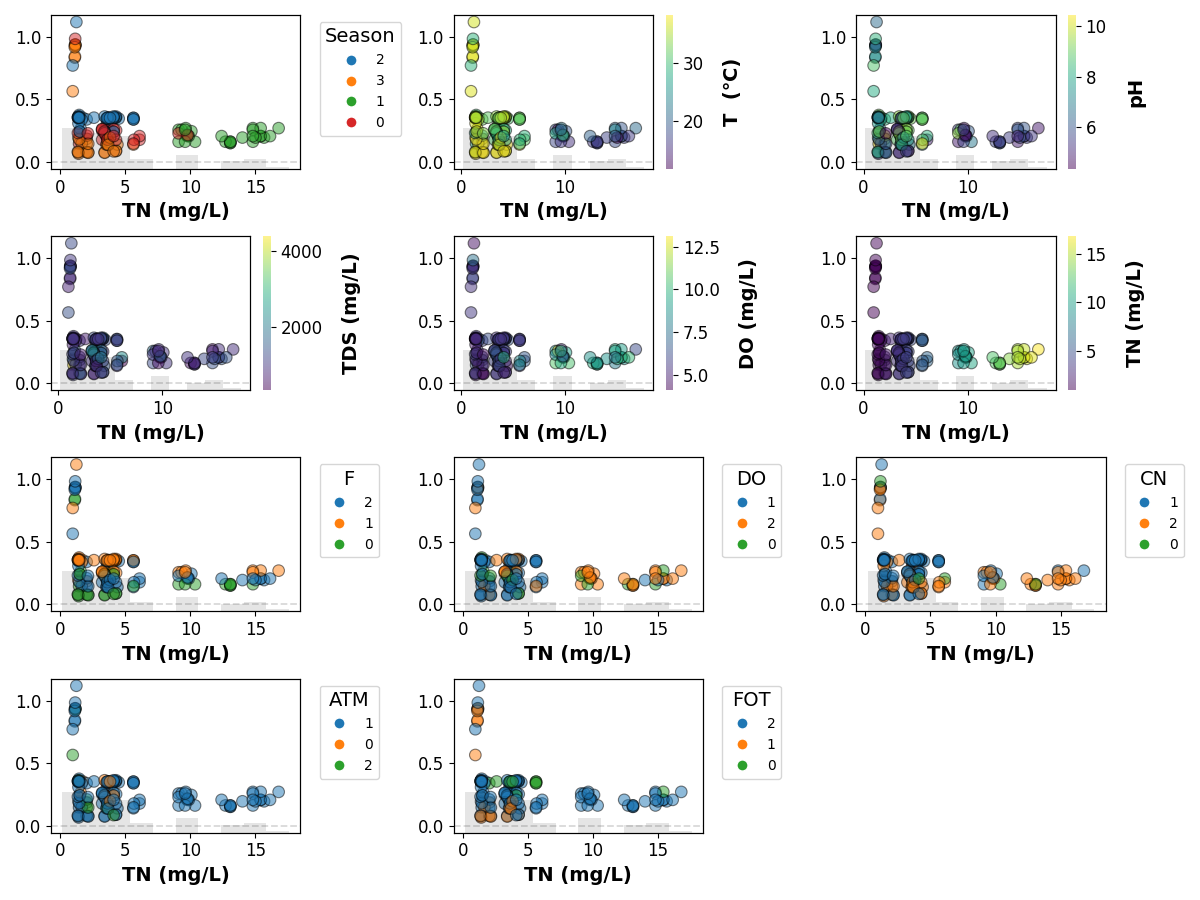
TEM
target = 'TEM'

TrainX, TrainY, TestX, TestY, inputs = return_train_test(target, 'no_genes')

model = get_no_gene_model(target, True, 'LGBMClassifier')

cols = TrainX.columns.tolist()
TrainX = pd.DataFrame(model._transform_x(TrainX), columns=cols)
#TestX = pd.DataFrame(model._transform_x(TestX), columns=cols)

# Create a SHAP explainer
explainer = TreeExplainer(model._model, TrainX,
                          feature_names=TrainX.columns)

# Calculate the SHAP values for the test set
shap_values = explainer.shap_values(TestX, TestY)
A column-vector y was passed when a 1d array was expected. Please change the shape of y to (n_samples, ), for example using ravel().
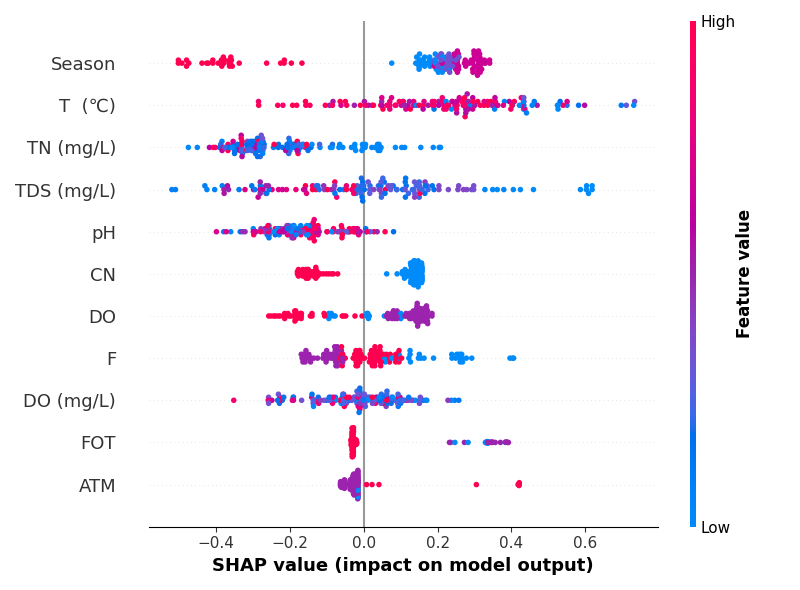
summary plot
summary_plot(shap_values,
         TestX,
         max_display=34,
    feature_names=[LABEL_MAP[n] if n in LABEL_MAP else n for n in TrainX.columns],
             show=False,
             class_names=['yes', 'no'])
if SAVE:
    plt.savefig(f"results/figures/shap_summary_{target}.png", dpi=600, bbox_inches="tight")
plt.tight_layout()
plt.show()
bar chart
sv_bar = np.mean(np.abs(shap_values), axis=0)

classes, colors_ = make_classes(explainer)

df_with_classes = pd.DataFrame(
    {'features': explainer.feature_names,
     'classes': classes,
     'mean_shap': sv_bar,
     'colors': colors_
     })

print(df_with_classes)


bar_pie(df_with_classes,
         save=SAVE,
         name=f"{target}",
        show=True)
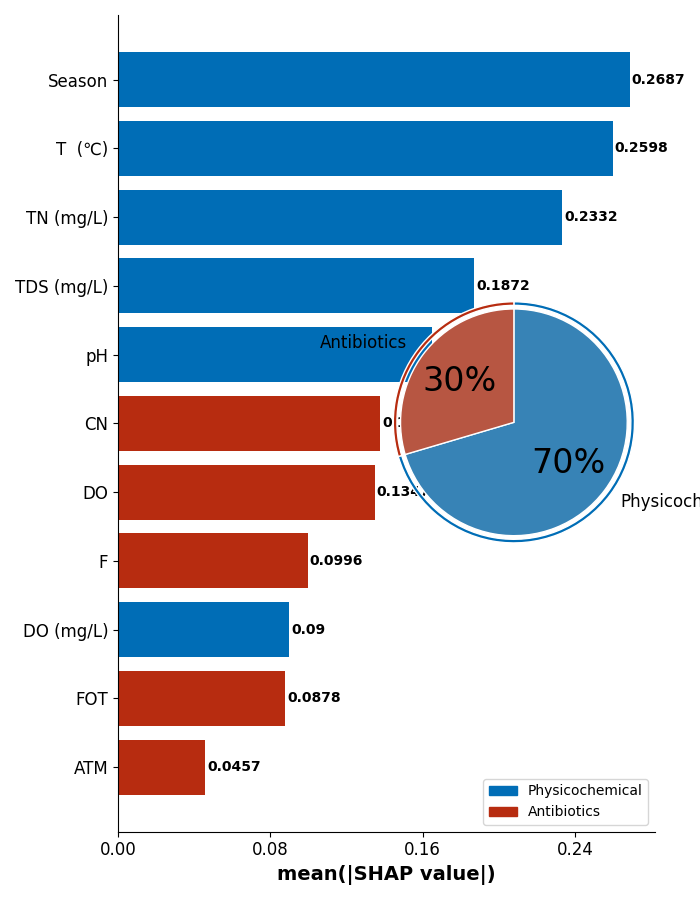
      features          classes  mean_shap   colors
0       season  Physicochemical   0.268711  #006db6
1       T  (℃)  Physicochemical   0.259834  #006db6
2           pH  Physicochemical   0.164977  #006db6
3   TDS (mg/L)  Physicochemical   0.187192  #006db6
4    DO (mg/L)  Physicochemical   0.090000  #006db6
5    TN (mg/L)  Physicochemical   0.233187  #006db6
6            F      Antibiotics   0.099594  #b72c10
7           DO      Antibiotics   0.134731  #b72c10
8           CN      Antibiotics   0.137772  #b72c10
9          ATM      Antibiotics   0.045679  #b72c10
10         FOT      Antibiotics   0.087778  #b72c10
This figure includes Axes that are not compatible with tight_layout, so results might be incorrect.
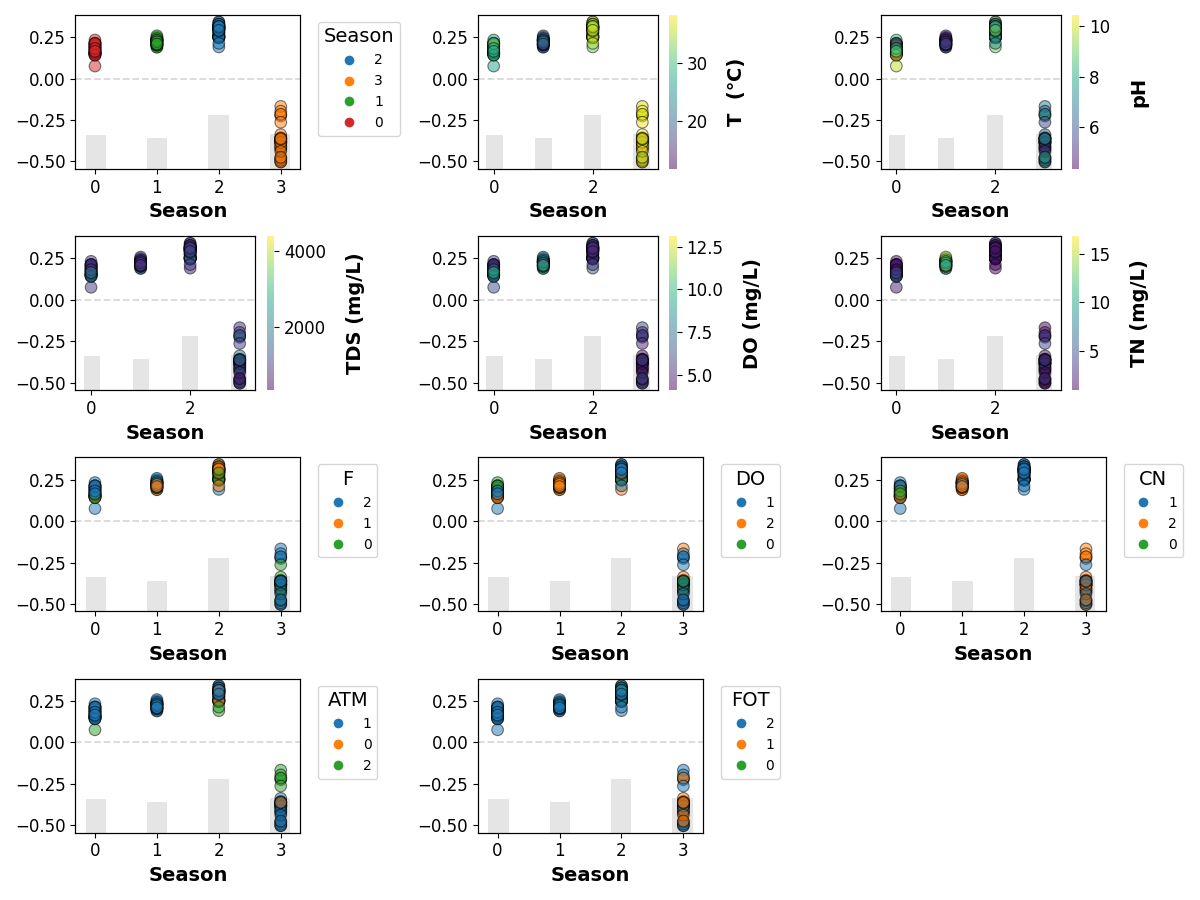
scatter plot
feature = 'season'
if feature in TrainX:
    shap_scatter_plots(
        shap_values,
        TestX,
        feature_name=feature,
        encoders=encoders,
        save=SAVE,
        name=target)
feature = 'T  (℃)'
if feature in TrainX:
    shap_scatter_plots(
        shap_values,
        TestX,
        feature_name=feature,
        encoders=encoders,
        save=SAVE,
        name=target)
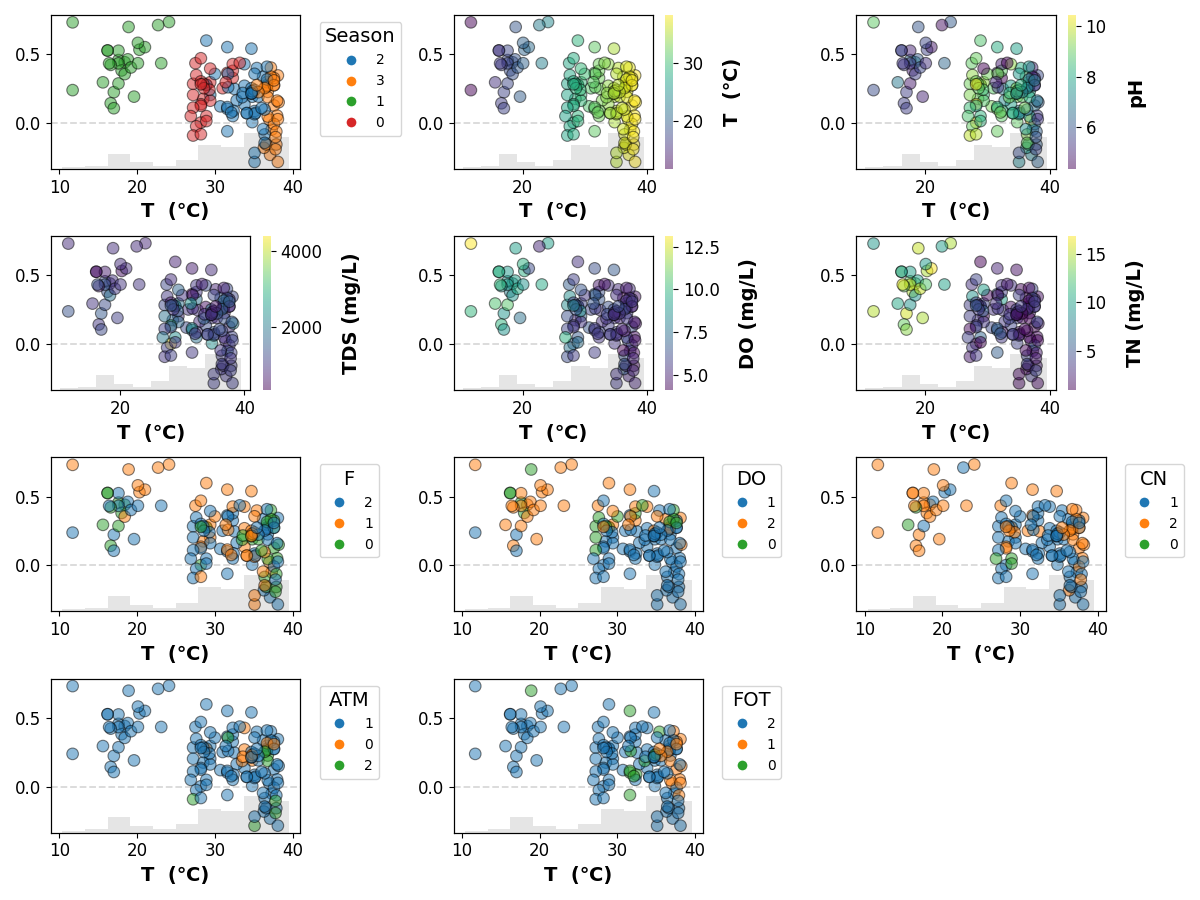
feature = 'pH'
if feature in TrainX:
    shap_scatter_plots(
        shap_values,
        TestX,
        feature_name=feature,
        encoders=encoders,
        save=SAVE,
        name=target)
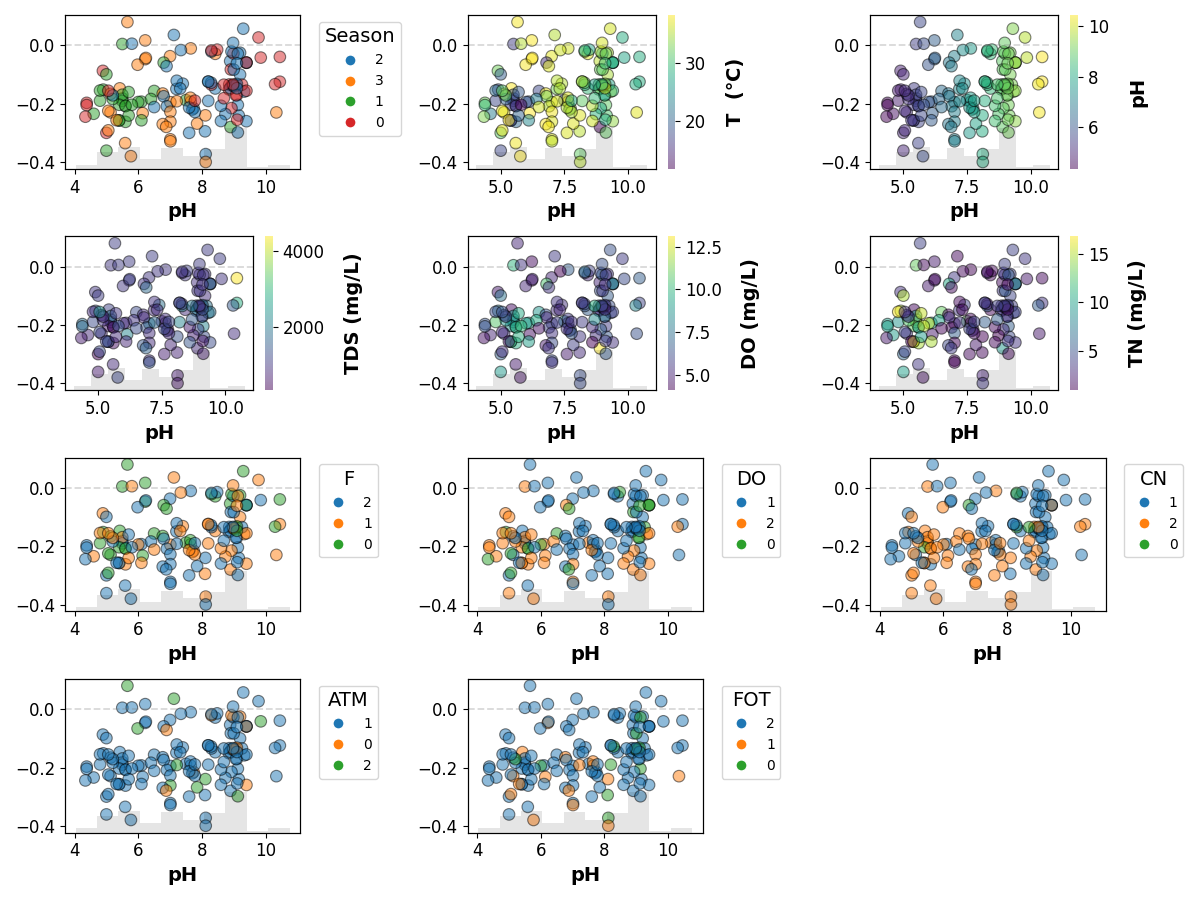
feature = 'TDS (mg/L)'
if feature in TrainX:
    shap_scatter_plots(
        shap_values,
        TestX,
        feature_name=feature,
        encoders=encoders,
        save=SAVE,
        name=target)
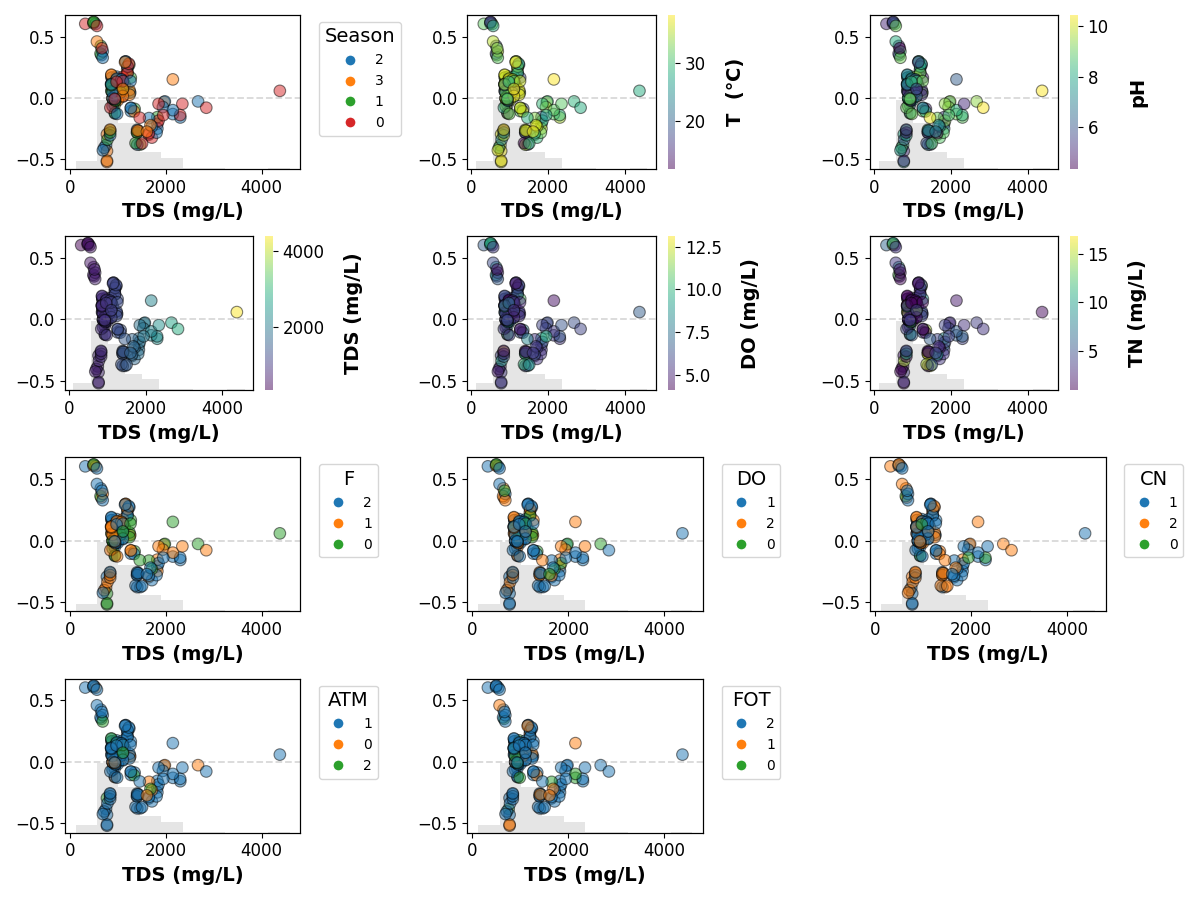
feature = 'DO (mg/L)'
if feature in TrainX:
    shap_scatter_plots(
        shap_values,
        TestX,
        feature_name=feature,
        encoders=encoders,
        save=SAVE,
        name=target)
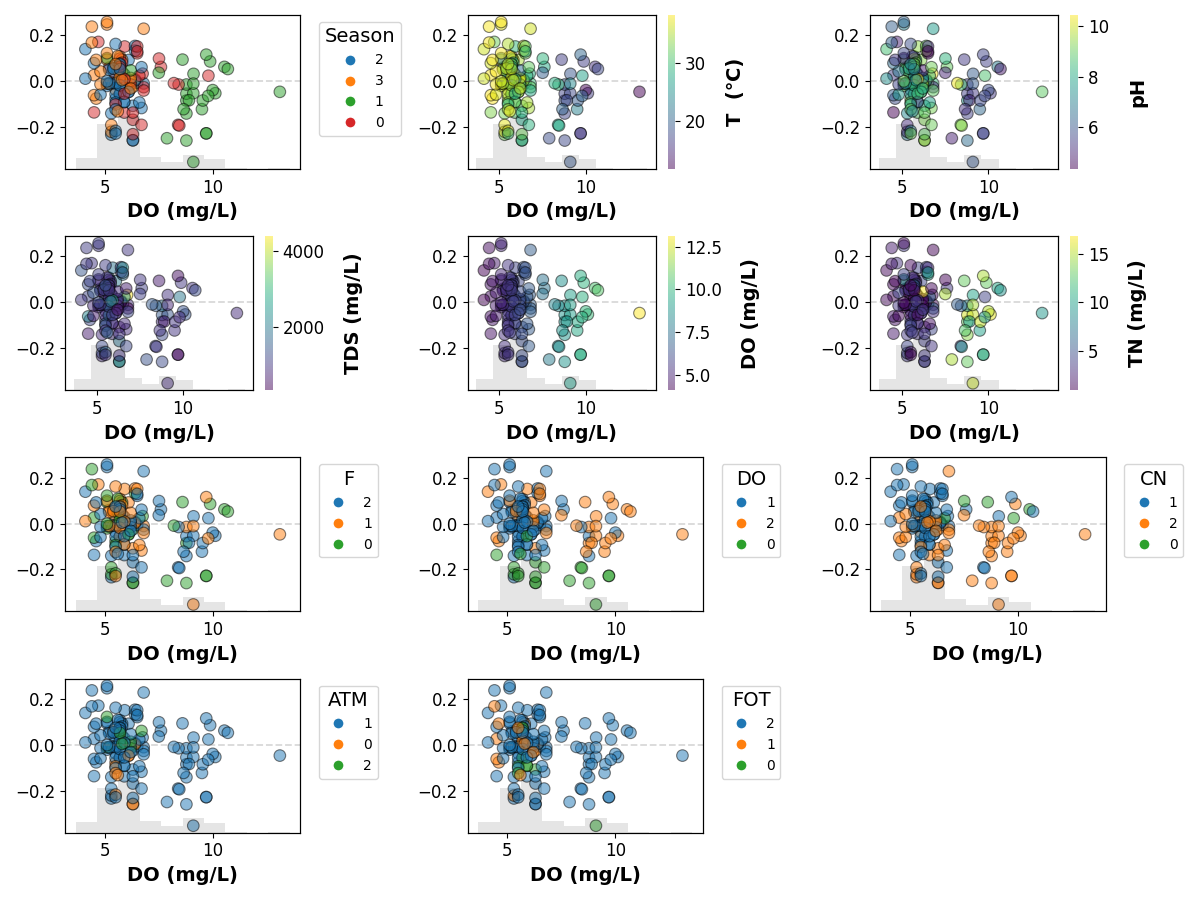
feature = 'TN (mg/L)'
if feature in TrainX:
    shap_scatter_plots(
        shap_values,
        TestX,
        feature_name=feature,
        encoders=encoders,
        save=SAVE,
        name=target)
CTX-M
target = 'CTX-M'

TrainX, TrainY, TestX, TestY, inputs = return_train_test(target, 'no_genes')

model = get_no_gene_model(target, 'LGBMClassifier')

cols = TrainX.columns.tolist()
#TrainX = pd.DataFrame(model._transform_x(TrainX), columns=cols)
#TestX = pd.DataFrame(model._transform_x(TestX), columns=cols)

# Create a SHAP explainer
explainer = TreeExplainer(model._model, TrainX,
                          feature_names=TrainX.columns)

# Calculate the SHAP values for the test set
shap_values = explainer.shap_values(TestX, TestY,
                                    check_additivity=False)
A column-vector y was passed when a 1d array was expected. Please change the shape of y to (n_samples, ), for example using ravel().
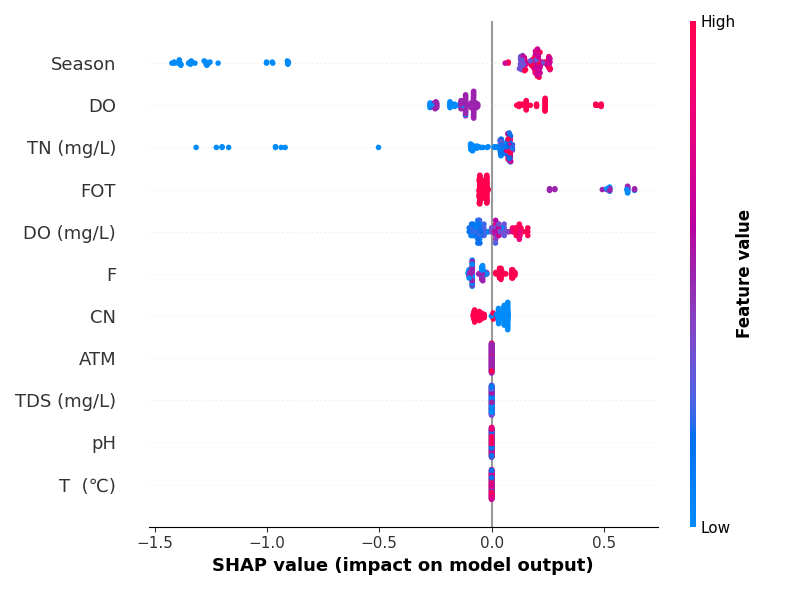
summary plot
summary_plot(shap_values,
         TestX,
         max_display=34,
    feature_names=[LABEL_MAP[n] if n in LABEL_MAP else n for n in TrainX.columns],
             show=False,
             class_names=['yes', 'no'])
if SAVE:
    plt.savefig(f"results/figures/shap_summary_{target}.png", dpi=600, bbox_inches="tight")
plt.tight_layout()
plt.show()
bar chart
sv_bar = np.mean(np.abs(shap_values), axis=0)

classes, colors_ = make_classes(explainer)

df_with_classes = pd.DataFrame(
    {'features': explainer.feature_names,
     'classes': classes,
     'mean_shap': sv_bar,
     'colors': colors_
     })

print(df_with_classes)


bar_pie(df_with_classes,
         save=SAVE,
         name=f"{target}",
        show=True)
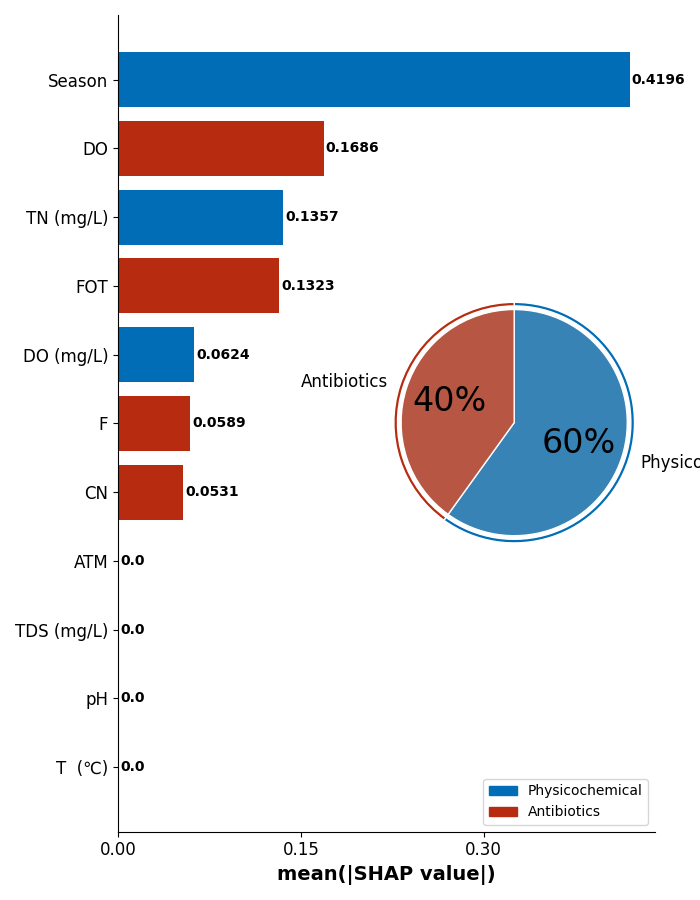
      features          classes  mean_shap   colors
0       season  Physicochemical   0.419635  #006db6
1       T  (℃)  Physicochemical   0.000000  #006db6
2           pH  Physicochemical   0.000000  #006db6
3   TDS (mg/L)  Physicochemical   0.000000  #006db6
4    DO (mg/L)  Physicochemical   0.062369  #006db6
5    TN (mg/L)  Physicochemical   0.135708  #006db6
6            F      Antibiotics   0.058948  #b72c10
7           DO      Antibiotics   0.168646  #b72c10
8           CN      Antibiotics   0.053085  #b72c10
9          ATM      Antibiotics   0.000000  #b72c10
10         FOT      Antibiotics   0.132325  #b72c10
This figure includes Axes that are not compatible with tight_layout, so results might be incorrect.
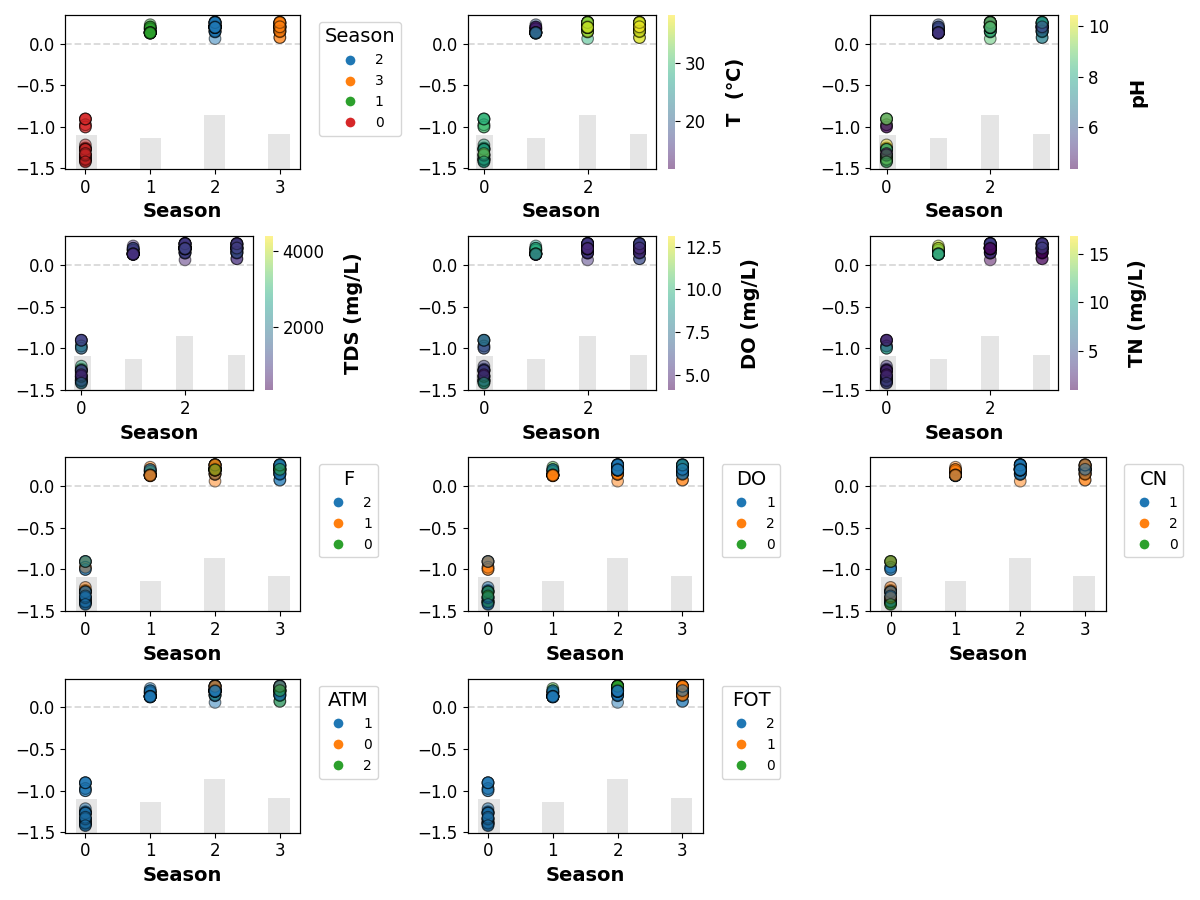
scatter plot
feature = 'season'
if feature in TrainX:
    shap_scatter_plots(
        shap_values,
        TestX,
        feature_name=feature,
        encoders=encoders,
        save=SAVE,
        name=target)
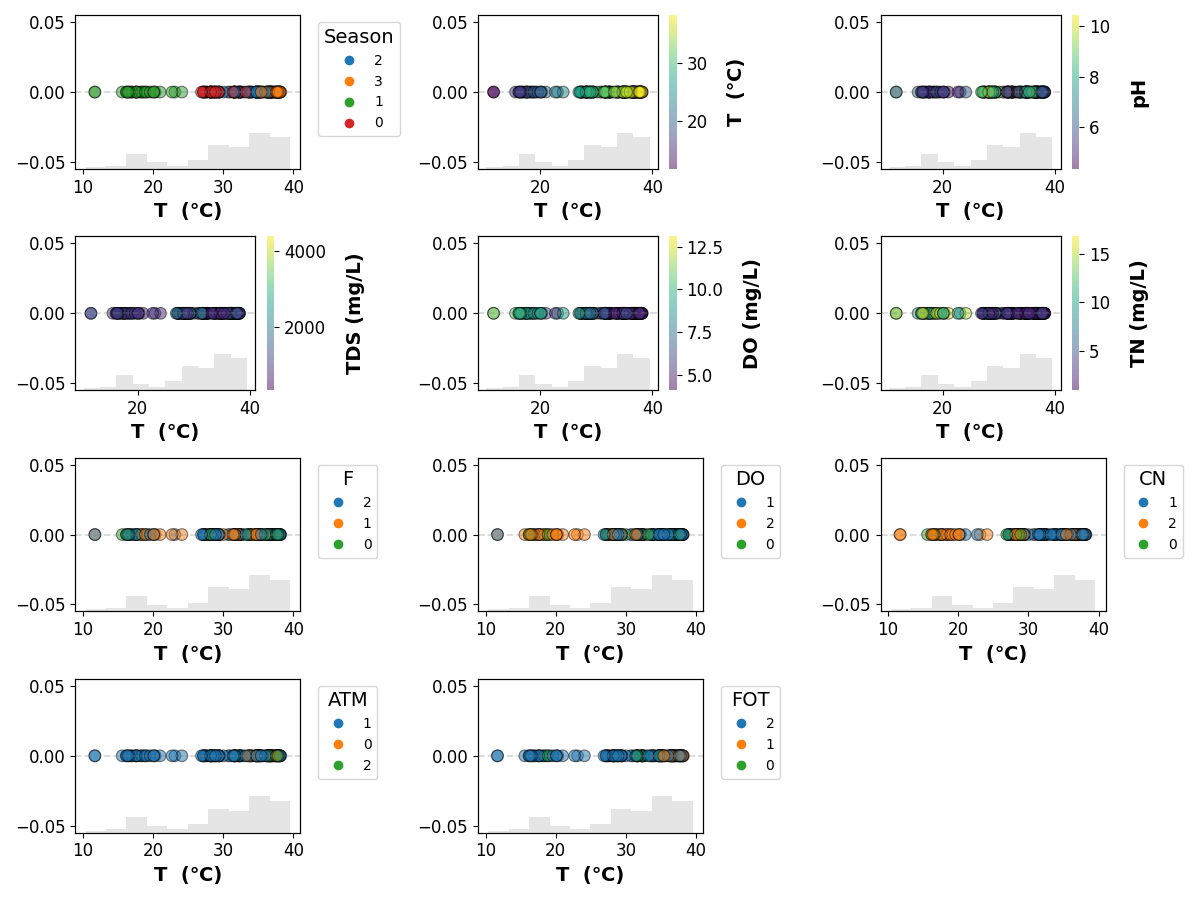
feature = 'T  (℃)'
if feature in TrainX:
    shap_scatter_plots(
        shap_values,
        TestX,
        feature_name=feature,
        encoders=encoders,
        save=SAVE,
        name=target)
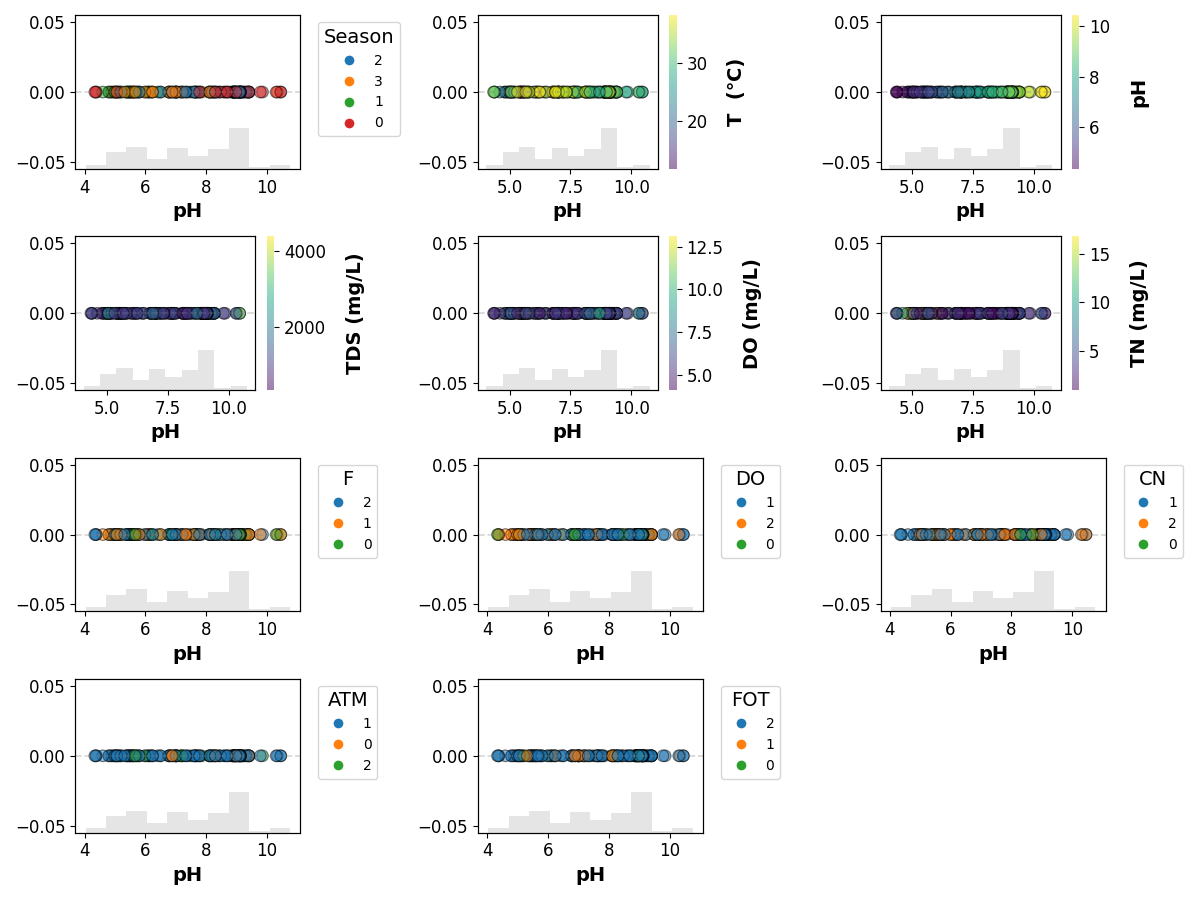
feature = 'pH'
if feature in TrainX:
    shap_scatter_plots(
        shap_values,
        TestX,
        feature_name=feature,
        encoders=encoders,
        save=SAVE,
        name=target)
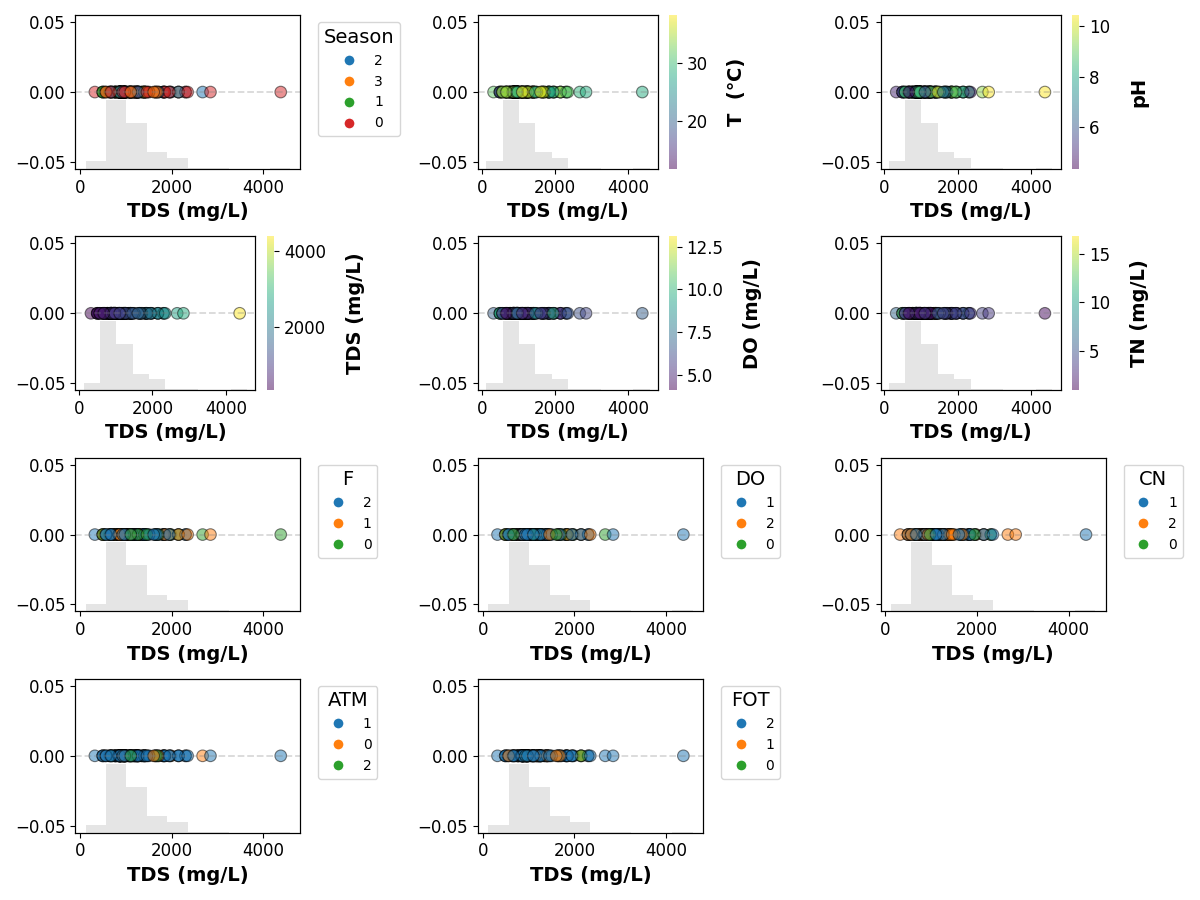
feature = 'TDS (mg/L)'
if feature in TrainX:
    shap_scatter_plots(
        shap_values,
        TestX,
        feature_name=feature,
        encoders=encoders,
        save=SAVE,
        name=target)
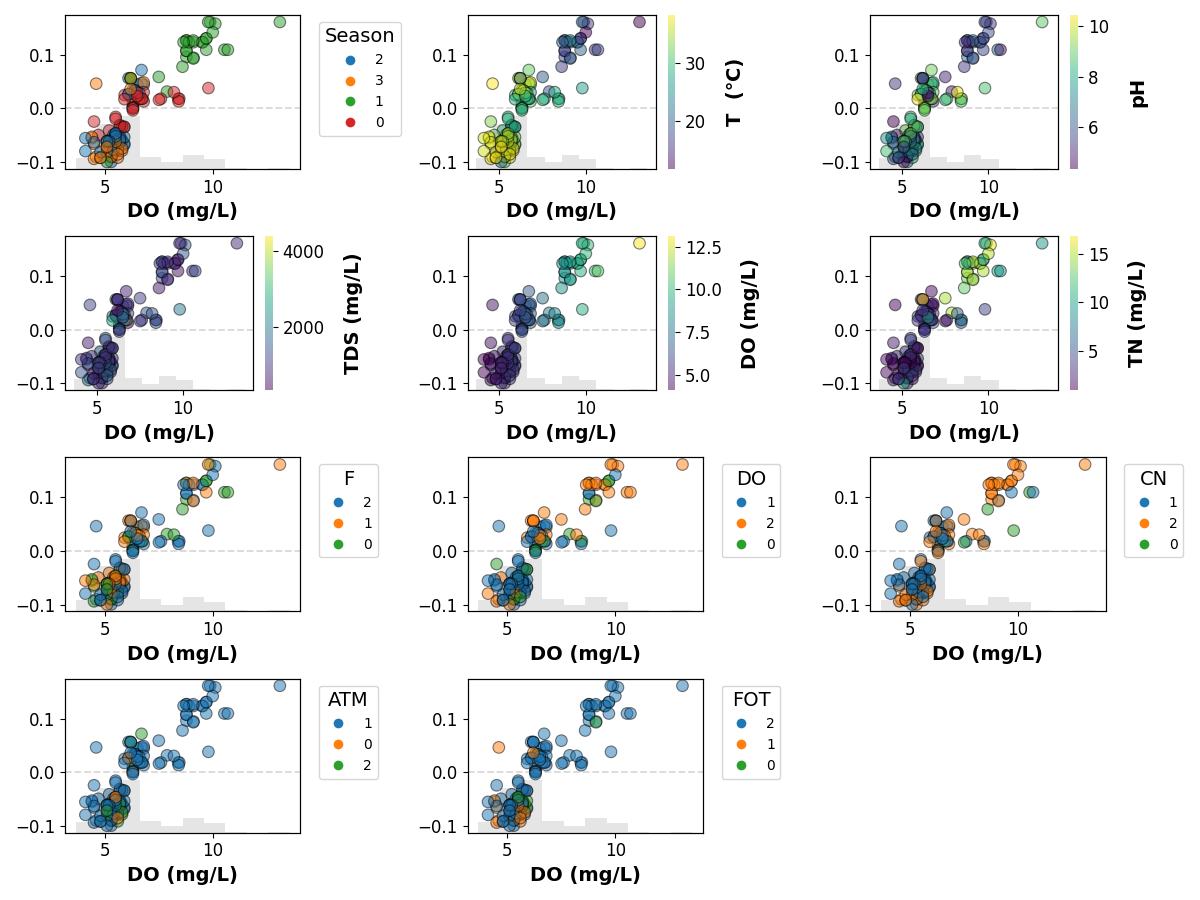
feature = 'DO (mg/L)'
if feature in TrainX:
    shap_scatter_plots(
        shap_values,
        TestX,
        feature_name=feature,
        encoders=encoders,
        save=SAVE,
        name=target)
feature = 'TN (mg/L)'
if feature in TrainX:
    shap_scatter_plots(
        shap_values,
        TestX,
        feature_name=feature,
        encoders=encoders,
        save=SAVE,
        name=target)
Total running time of the script: ( 2 minutes 49.939 seconds)