Note
Go to the end to download the full example code
1. Exploratory Data Analysis
import matplotlib.pyplot as plt

import numpy as np
import seaborn as sns
from dython.nominal import associations

from easy_mpl import plot, boxplot
from easy_mpl.utils import create_subplots
from easy_mpl import pie

from utils import SAVE
from utils import plot_line, plot_boxplot, set_rcParams
from utils import read_data, lineplot, version_info
Since version 1.0, it is not needed to import enable_hist_gradient_boosting anymore. HistGradientBoostingClassifier and HistGradientBoostingRegressor are now stable and can be normally imported from sklearn.ensemble.
WARNING:tensorflow:From /home/docs/checkouts/readthedocs.org/user_builds/isl-env-ai/envs/latest/lib/python3.7/site-packages/ai4water/backend.py:80: The name tf.keras.losses.cosine is deprecated. Please use tf.keras.losses.cosine_similarity instead.

WARNING:tensorflow:From /home/docs/checkouts/readthedocs.org/user_builds/isl-env-ai/envs/latest/lib/python3.7/site-packages/ai4water/backend.py:80: The name tf.keras.losses.cosine_proximity is deprecated. Please use tf.keras.losses.cosine_similarity instead.

WARNING:tensorflow:From /home/docs/checkouts/readthedocs.org/user_builds/isl-env-ai/envs/latest/lib/python3.7/site-packages/ai4water/backend.py:80: The name tf.keras.layers.CuDNNGRU is deprecated. Please use tf.compat.v1.keras.layers.CuDNNGRU instead.

WARNING:tensorflow:From /home/docs/checkouts/readthedocs.org/user_builds/isl-env-ai/envs/latest/lib/python3.7/site-packages/ai4water/backend.py:80: The name tf.keras.layers.CuDNNLSTM is deprecated. Please use tf.compat.v1.keras.layers.CuDNNLSTM instead.
version_info()
python 3.7.17 (default, Jun 25 2023, 21:20:48)
[GCC 11.3.0]
os posix
ai4water 1.07
lightgbm 4.0.0
easy_mpl 0.21.4
SeqMetrics 1.3.4
tensorflow 1.15.0
tensorflow.python.keras.api._v1.keras 2.2.4-tf
numpy 1.19.5
pandas 1.3.5
matplotlib 3.5.3
h5py 2.10.0
sklearn 1.0.2
optuna 3.2.0
skopt 0.9.0
seaborn 0.12.2
shap 0.41.0
set_rcParams()
Whole Data
reading whole data
data = read_data()
print(data.shape)
(466, 34)
data.isna().sum()
season         0
Isolate ID     0
Qnr A          2
Qnr B          0
QnrS          17
IMP            1
NDM            0
BIC            0
KPC            0
OXA48          0
TEM            0
SHV            0
CTX-M          0
MCR-1         26
AMP            0
CAZ            0
AMC            0
CTX            0
FEP            0
ATM            0
MEM            0
CIP            0
C              0
NA             0
CN             0
DO             0
F              0
FOT            0
SXT            0
T  (℃)         0
pH             0
TDS (mg/L)     0
DO (mg/L)      0
TN (mg/L)      0
dtype: int64
data.head()
data.tail()
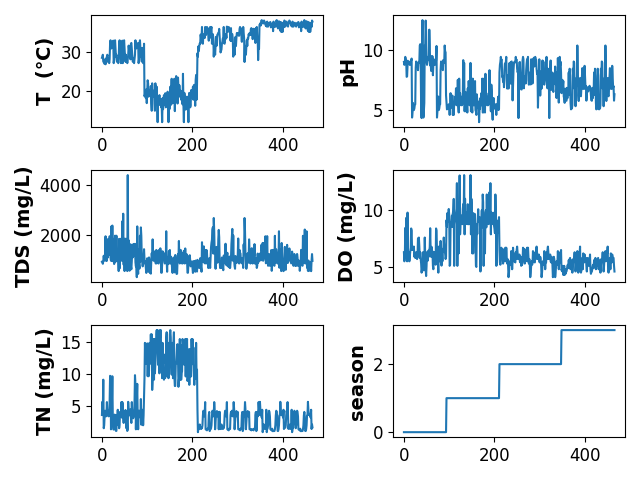
plotting a line plot of numerical features
lineplot(save=SAVE)
findfont: Font family ['Times New Roman'] not found. Falling back to DejaVu Sans.
findfont: Font family ['Times New Roman'] not found. Falling back to DejaVu Sans.
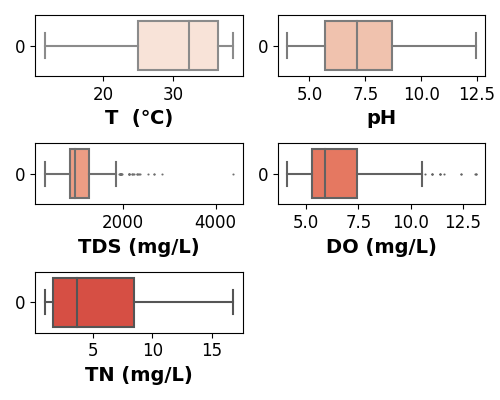
plotting a boxplot of numerical features without season
wat_chem_cols = ['T  (℃)', 'pH', 'TDS (mg/L)',
                             'DO (mg/L)', 'TN (mg/L)']

fig, axes = create_subplots(len(wat_chem_cols), figsize=(5,4))

colors = ['#FEE1D2', '#FBBEA3', '#FE9473', '#FB6A4B', '#EE3A2C']
for ax, col, color in zip(axes.flat, wat_chem_cols, colors):
    sns.boxplot(data[col], ax=ax,
                fliersize=0.6,
                color=color,
                orient='h',
                )
    ax.set_xlabel(col)
plt.tight_layout()
if SAVE:
    plt.savefig("results/figures/box_num", bbox_inches="tight", dpi=600)
plt.show()
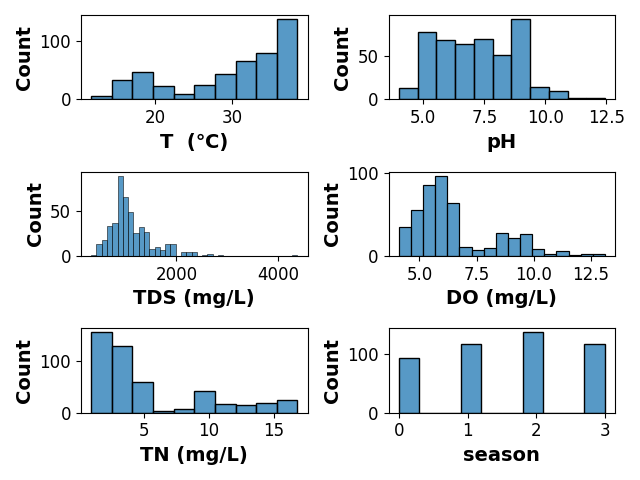
histogram of numerical features
num_columns = ['T  (℃)', 'pH', 'TDS (mg/L)',
               'DO (mg/L)', 'TN (mg/L)', 'season']

fig, axes = create_subplots(len(num_columns))

if not isinstance(axes, np.ndarray):
    axes = np.array([axes])

for ax, col in zip(axes.flat, num_columns):
    sns.histplot(data[col], ax=ax,
                 )
plt.tight_layout()
if SAVE:
    plt.savefig("results/figures/hist_num", bbox_inches="tight", dpi=600)
plt.show()
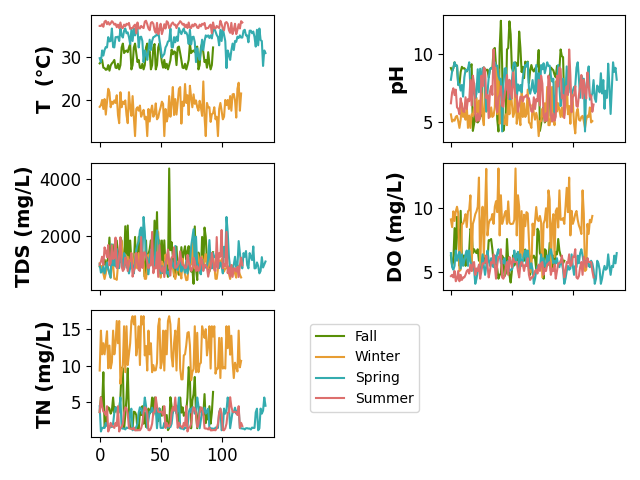
Season Wise
SEASONS = {
    0: "Fall",
    1: "Winter",
    2: "Spring",
    3: "Summer"
}

COLUMNS = ['T  (℃)', 'pH', 'TDS (mg/L)', 'DO (mg/L)', 'TN (mg/L)']
groups = data.groupby('season')

f, axes = create_subplots(5, sharex="all")

colors = ['#588F07', '#E79D33', '#34ACAF', '#DD6F6D']

for col, ax in zip(COLUMNS, axes.flatten()):

    for (label, grp), color in zip(groups, colors):

        legend = '__nolabel__'
        if col == 'TN (mg/L)':
            legend = SEASONS[label]

        plot(grp[col].values, color=color, label=legend, ax=ax, show=False)

    ax.set_ylabel(col)
    if col == 'TN (mg/L)':
        ax.legend(loc=(1.2, 0.2))

if SAVE:
    plt.savefig("results/figures/seasonwise_line", bbox_inches="tight", dpi=600)
plt.tight_layout()
plt.show()
findfont: Font family ['Times New Roman'] not found. Falling back to DejaVu Sans.
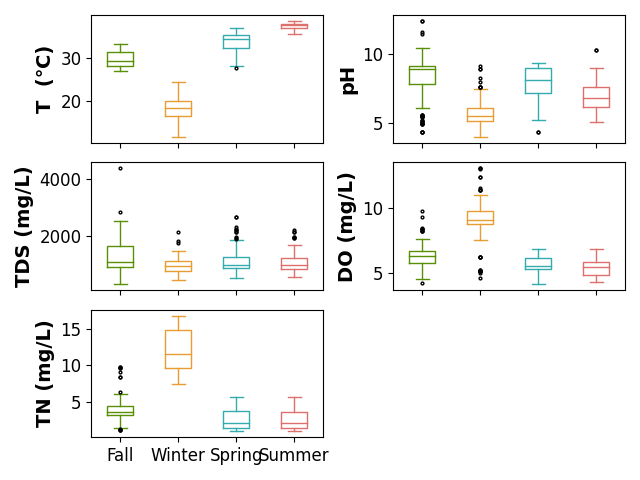
f, axes = create_subplots(5, sharex="all")

for col, ax in zip(COLUMNS, axes.flatten()):

    data_ = [grp[col].values for _, grp in groups]
    labels = [SEASONS[label] for label, _ in groups]
    boxplot(data_, labels=labels, line_color=colors,
            #fill_color=colors, patch_artist=True,
            ax=ax, show=False,
            flierprops=dict(ms=2.0))

    ax.set_ylabel(col)
    if col in ['TN (mg/L)', 'DO (mg/L)']:
        ax.set_xticks([1, 2, 3, 4])
        ax.set_xticklabels(labels)
plt.tight_layout()
if SAVE:
    plt.savefig("results/figures/seasonwise_box.png", bbox_inches="tight", dpi=600)
plt.show()
xticks (8) and xticklabels (4) dont match

xticks (12) and xticklabels (4) dont match

xticks (16) and xticklabels (4) dont match

xticks (8) and xticklabels (4) dont match
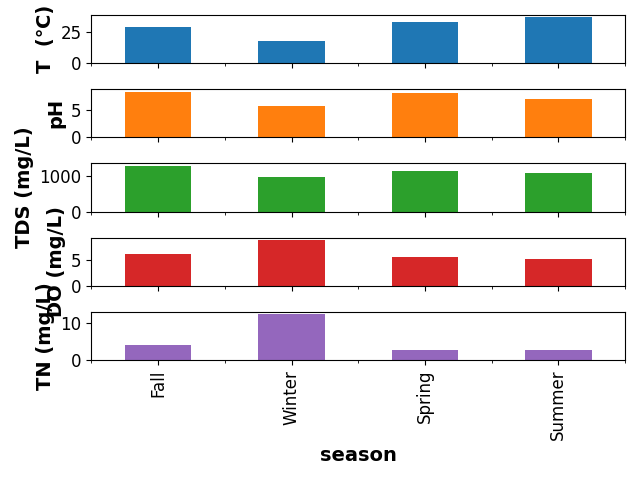
Mean values in each season
axes = data[COLUMNS + ['season']].groupby('season').mean().plot(kind="bar", subplots=True)
for ax in axes:
    ax.set_ylabel(ax.get_title())
    ax.set_title('')
    ax.legend().remove()
plt.xticks([0, 1, 2, 3], SEASONS.values())
plt.tight_layout()
if SAVE:
    plt.savefig("results/figures/season_mean.png", bbox_inches="tight", dpi=600)
plt.show()
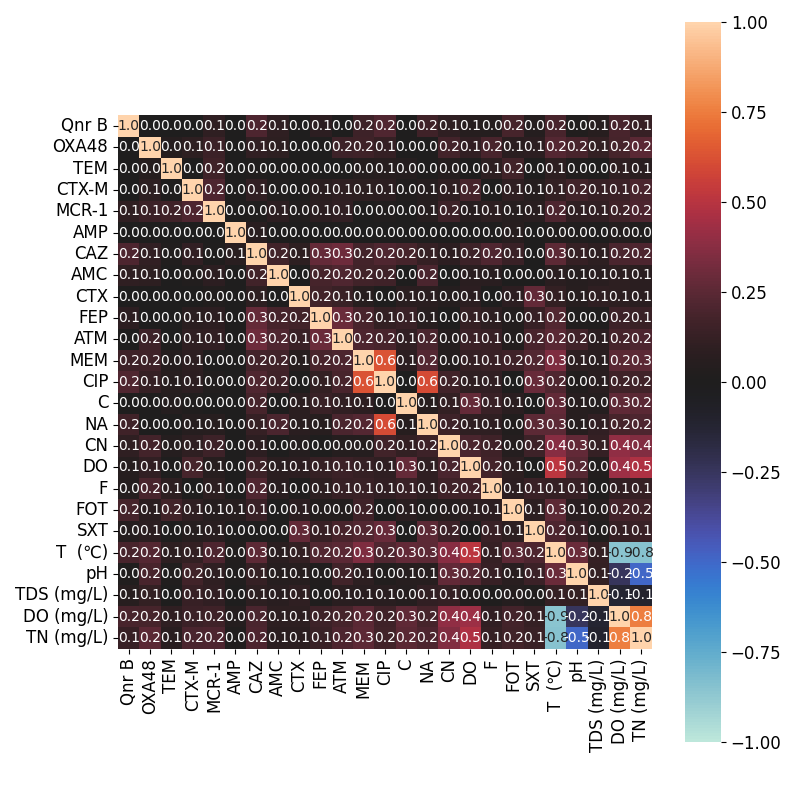
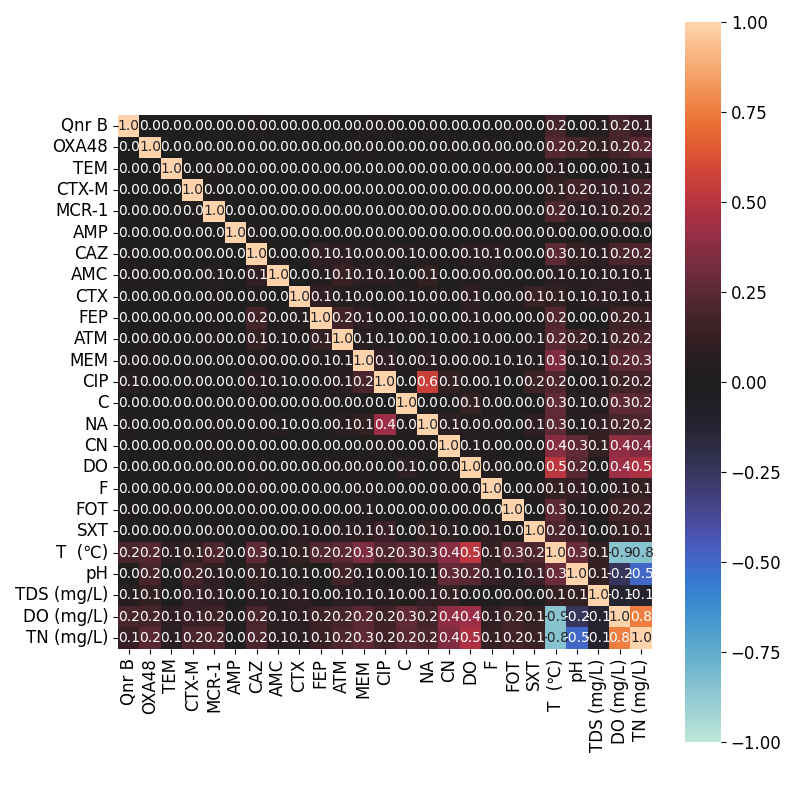
_ = associations(
    data.drop(columns=["season", "BIC", "Isolate ID", 'SHV',
                        'KPC', 'NDM', 'IMP', 'QnrS', 'Qnr A']),
    nom_nom_assoc="cramer",
    fmt=".1f",
    figsize=(8, 8),
    plot=False,
    cbar=True
)
plt.tight_layout()
if SAVE:
    plt.savefig("results/figures/corr_cat.png", bbox_inches="tight", dpi=600)
plt.show()
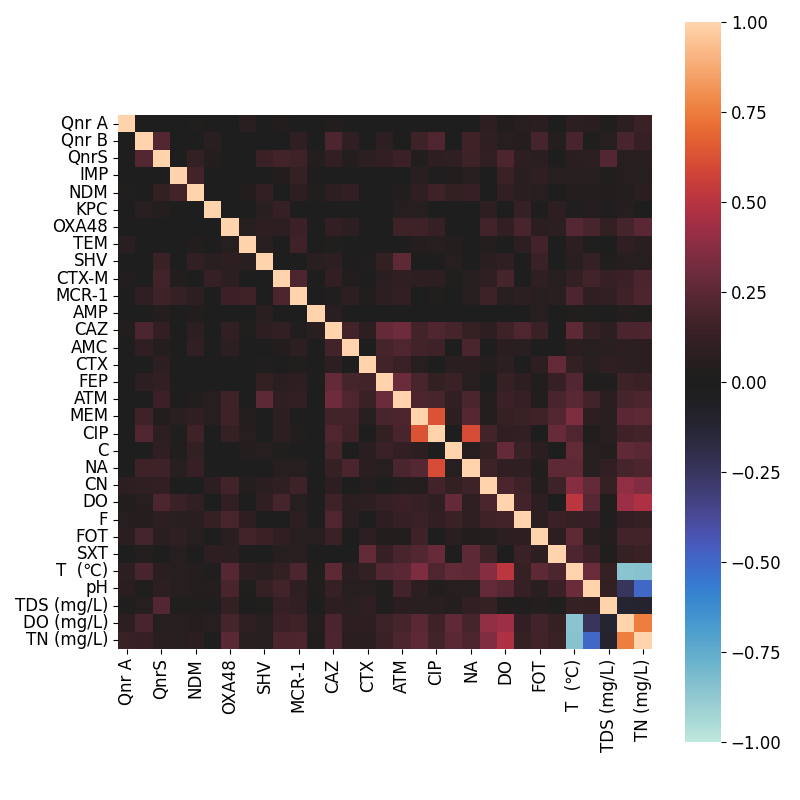
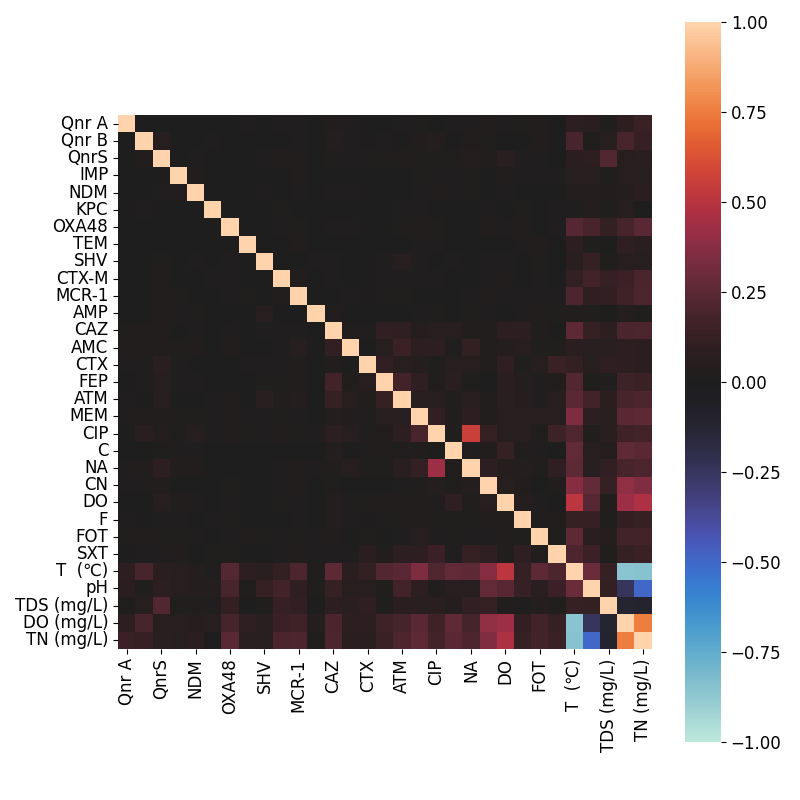
_ = associations(
    data.drop(columns=["season", "BIC", "Isolate ID"]),
    nom_nom_assoc="cramer",
    fmt=".1f",
    figsize=(8, 8),
    plot=False,
    cbar=True,
    annot=False
)
plt.tight_layout()
if SAVE:
    plt.savefig("results/figures/corr_0.png", bbox_inches="tight", dpi=600)
plt.show()
output = associations(
    data.drop(columns=["season", "BIC", "Isolate ID", 'SHV',
                        'KPC', 'NDM', 'IMP', 'QnrS', 'Qnr A']),
    nom_nom_assoc="theil",
    fmt=".1f",
    figsize=(8, 8),
    plot=False,
    cbar=True,
)
plt.tight_layout()
if SAVE:
    plt.savefig("results/figures/corr_0_nom_nom_theil.png", bbox_inches="tight", dpi=600)
plt.show()
_ = associations(
    data.drop(columns=["season", "BIC", "Isolate ID"]),
    nom_nom_assoc="theil",
    fmt=".1f",
    annot=False,
    figsize=(8, 8),
    plot=False,
    cbar=True,
)
plt.tight_layout()
if SAVE:
    plt.savefig("results/figures/corr_0_nom_nom_theil0.png", bbox_inches="tight", dpi=600)
plt.show()
Antibiotics
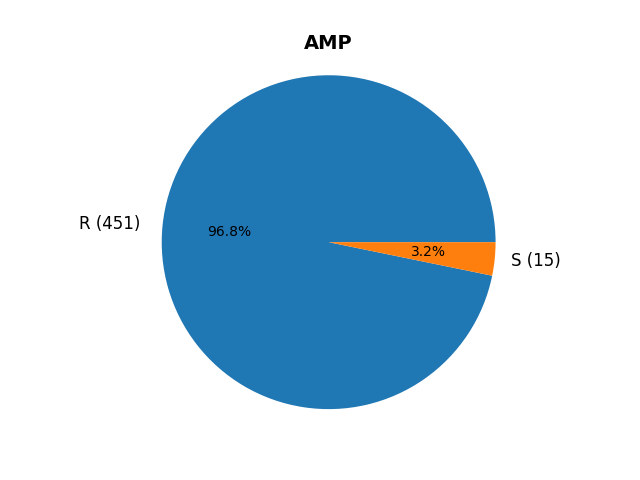
AMP
feature = 'AMP'
# The unique values in AMP are listed below.
print(f'unique values in {feature}: {data[feature].unique()}')
unique values in AMP: ['R' 'S']
_ = pie(data[feature].values, ax_kws=dict(title=feature), show=False)
if SAVE:
    plt.savefig(f"results/figures/pie_{feature}.png", bbox_inches="tight", dpi=600)
plt.show()
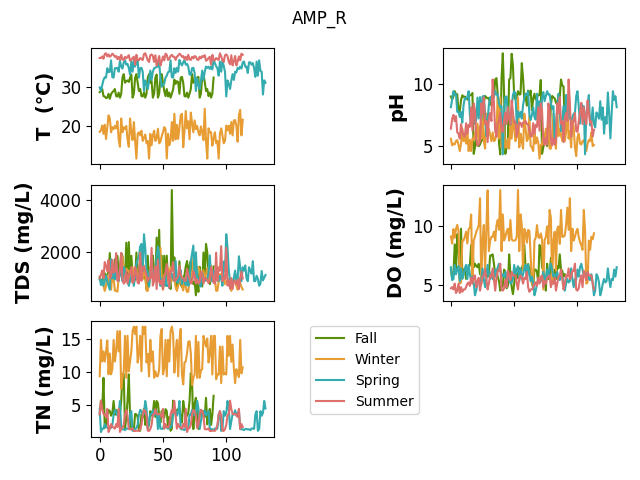
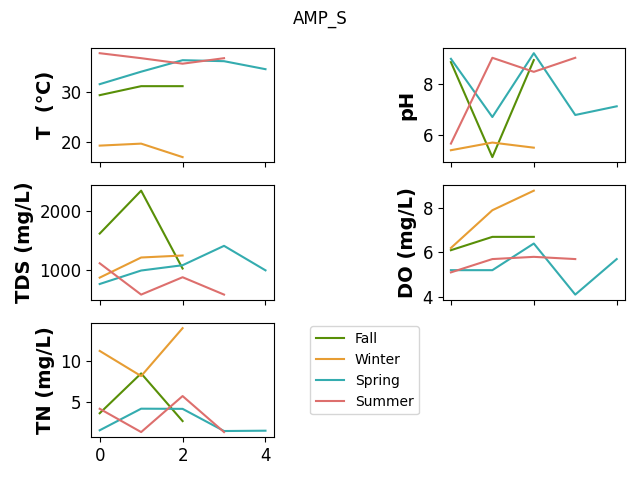
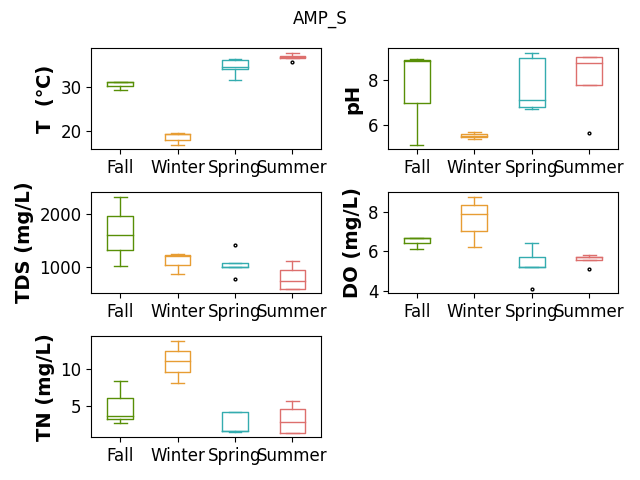
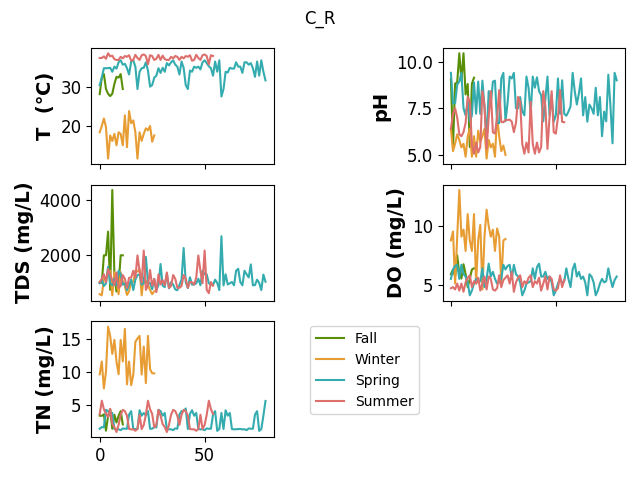
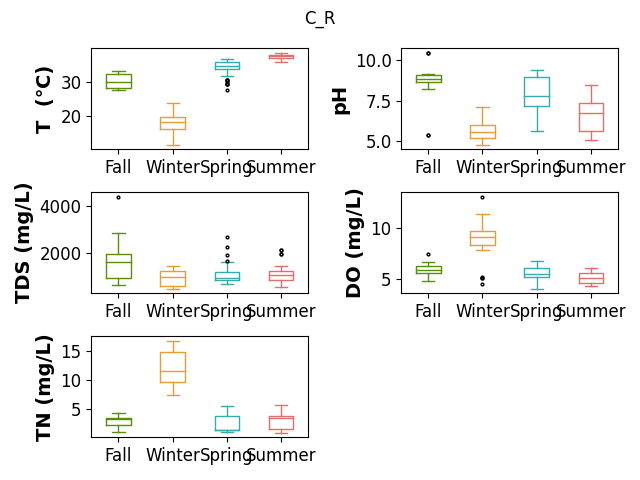
# Following two plots (line and box plot) shows the distribution of
# enviormental features of the samples where AMP values is 'R'.
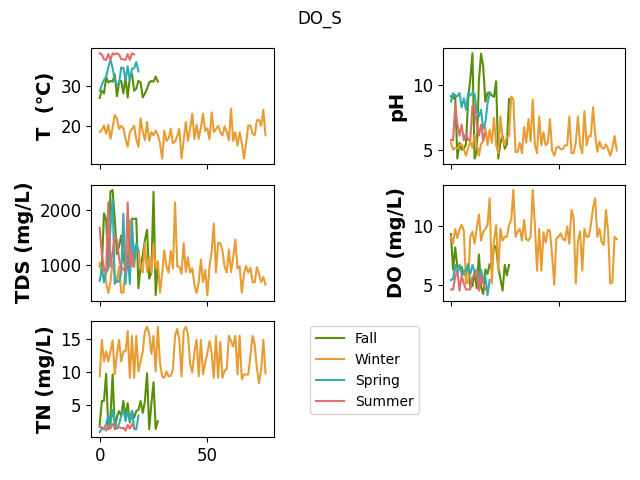
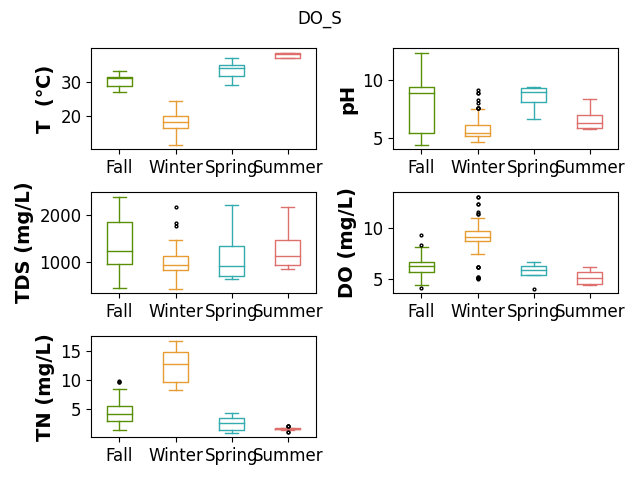
plot_line(feature, 'R', save=SAVE)
plot_boxplot(feature, 'R', save=SAVE)

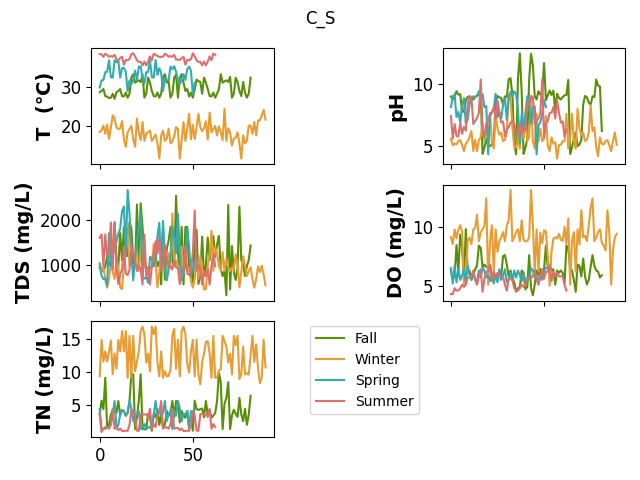
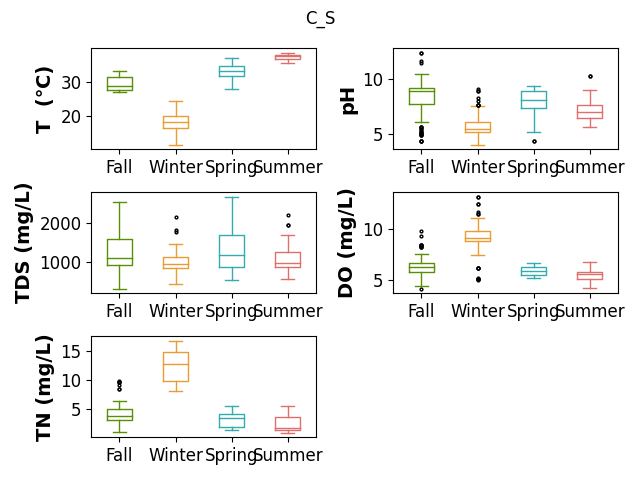
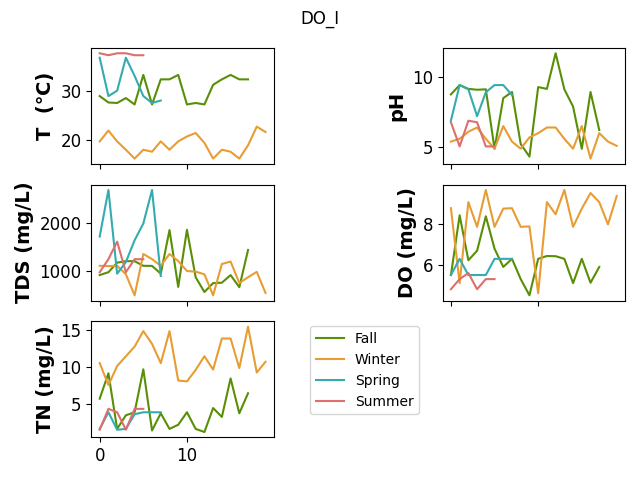
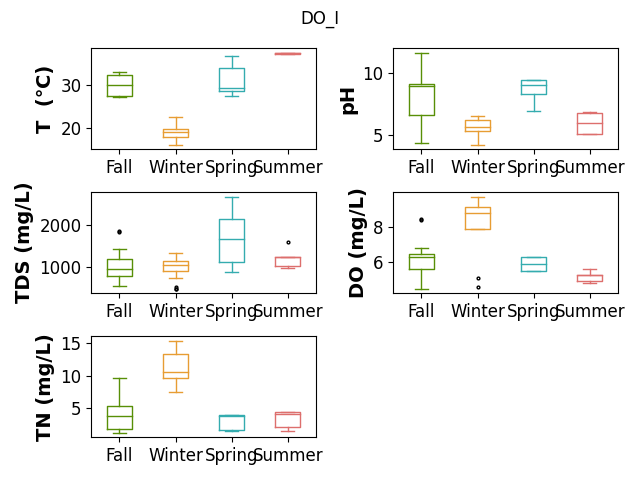
# Following two plots (line and box plot) shows the distribution of
# enviormental features of the samples where AMP values is 'S'.

plot_line(feature, 'S', save=SAVE)
plot_boxplot(feature, 'S', save=SAVE)
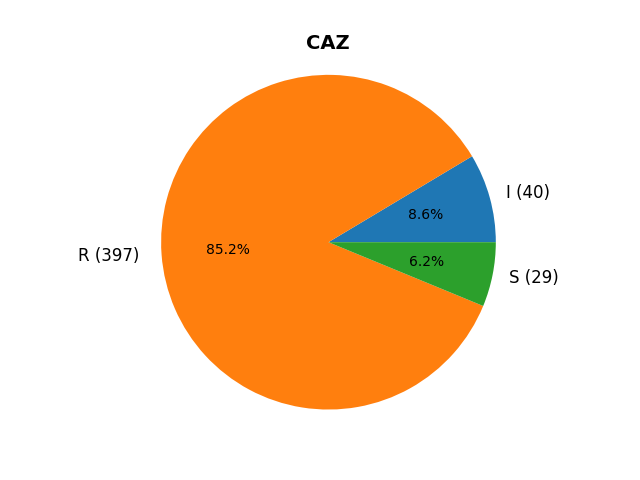
CAZ
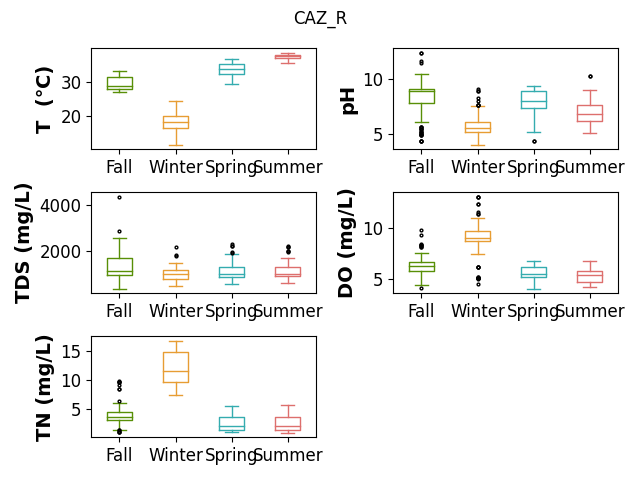
feature = 'CAZ'

print(f'unique values in {feature}: {data[feature].unique()}')
unique values in CAZ: ['R' 'S' 'I']
_ = pie(data[feature].values, ax_kws=dict(title=feature), show=False)
if SAVE:
    plt.savefig(f"results/figures/pie_{feature}.png", bbox_inches="tight", dpi=600)
plt.show()
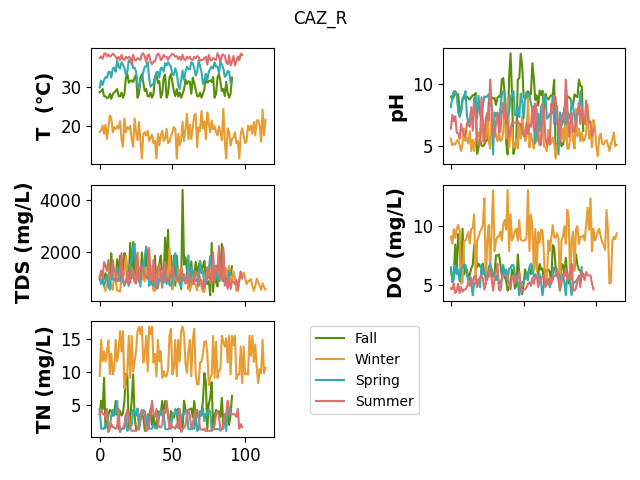
plot_line(feature, 'R', save=SAVE)
plot_boxplot(feature, 'R', save=SAVE)
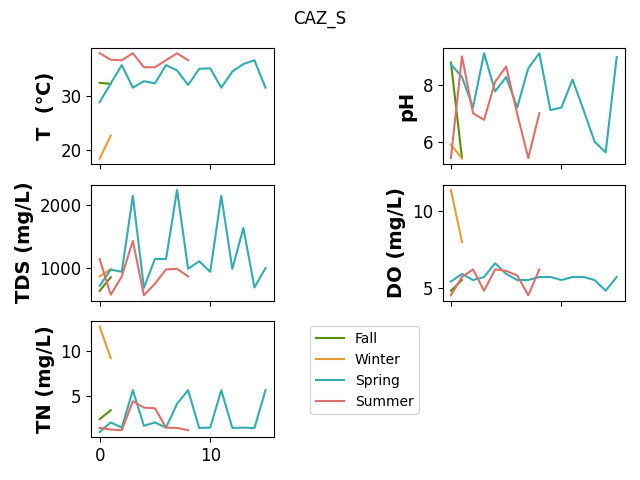
plot_line(feature, 'S', save=SAVE)
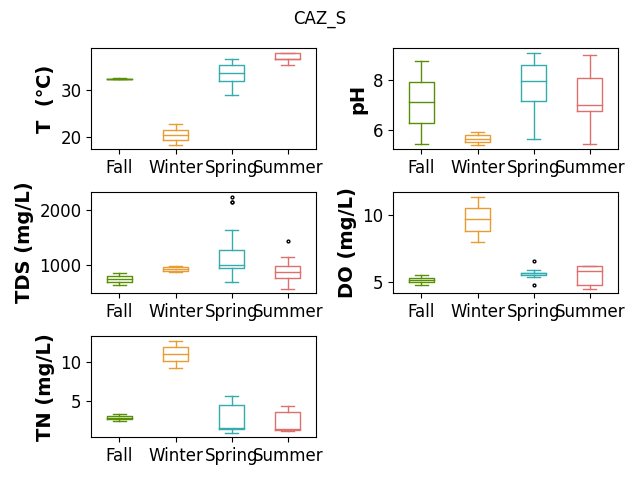
plot_boxplot(feature, 'S', save=SAVE)
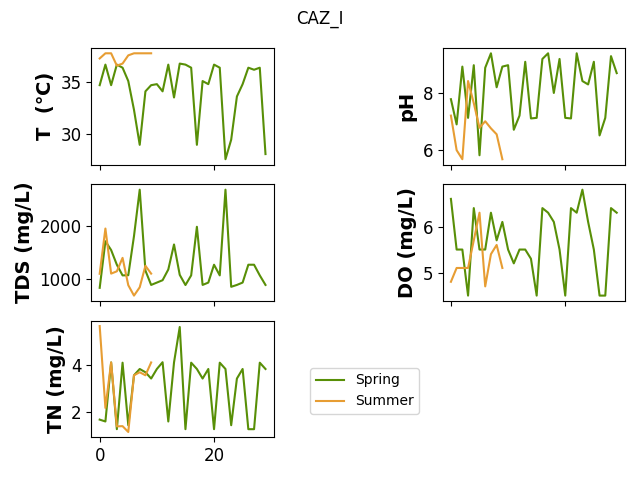
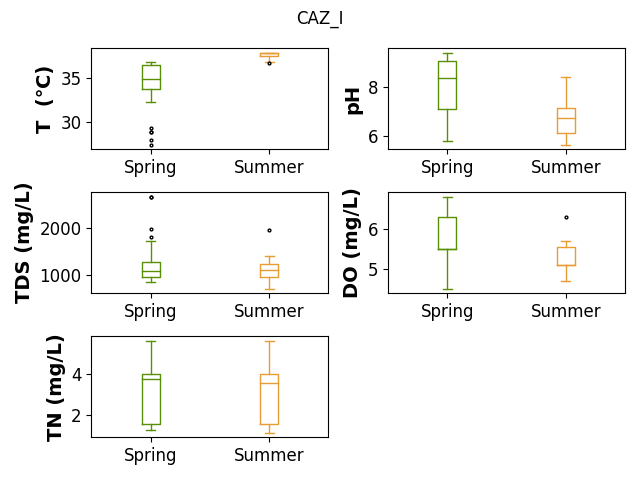
plot_line(feature, 'I', save=SAVE)
plot_boxplot(feature, 'I', save=SAVE)
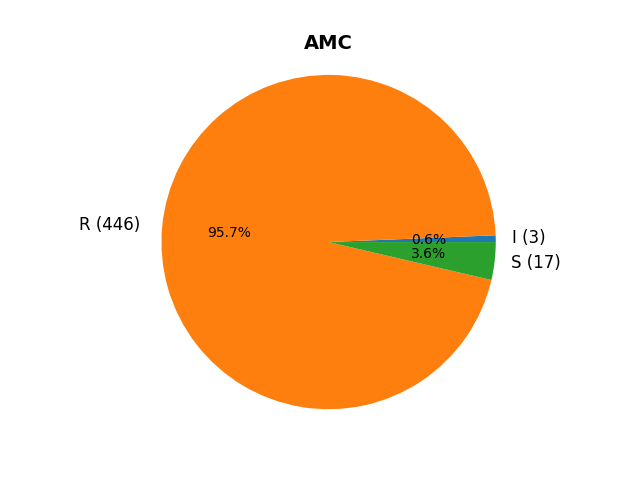
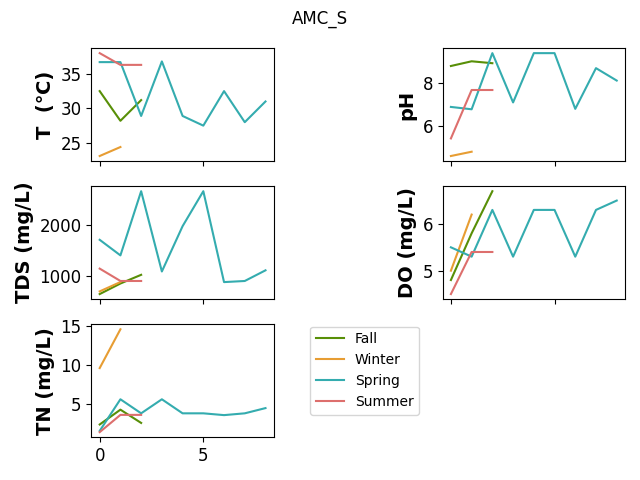
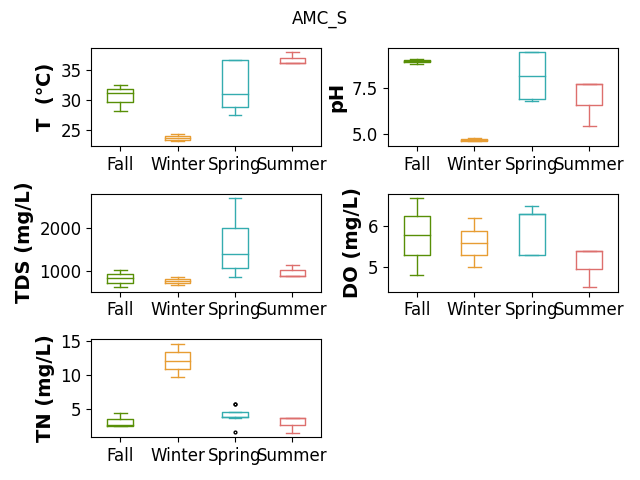
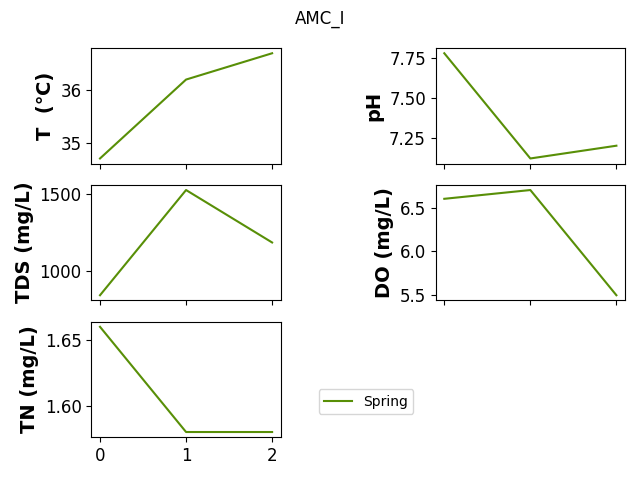
AMC
feature = 'AMC'

print(f'unique values in {feature}: {data[feature].unique()}')
unique values in AMC: ['R' 'S' 'I']
_ = pie(data[feature].values, ax_kws=dict(title=feature), show=False)
if SAVE:
    plt.savefig(f"results/figures/pie_{feature}.png", bbox_inches="tight", dpi=600)
plt.show()
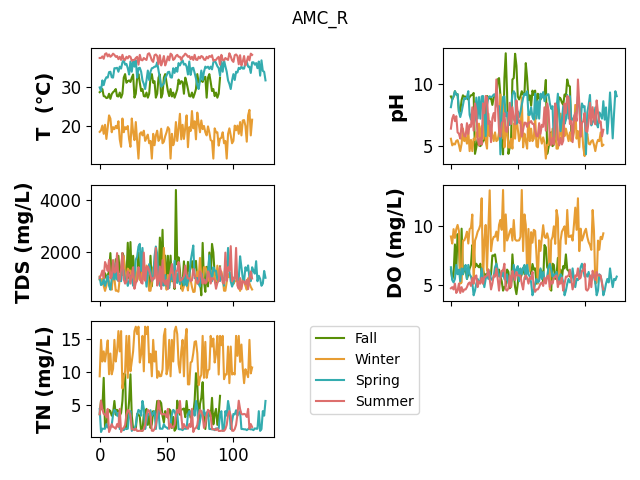
plot_line(feature, 'R', save=SAVE)
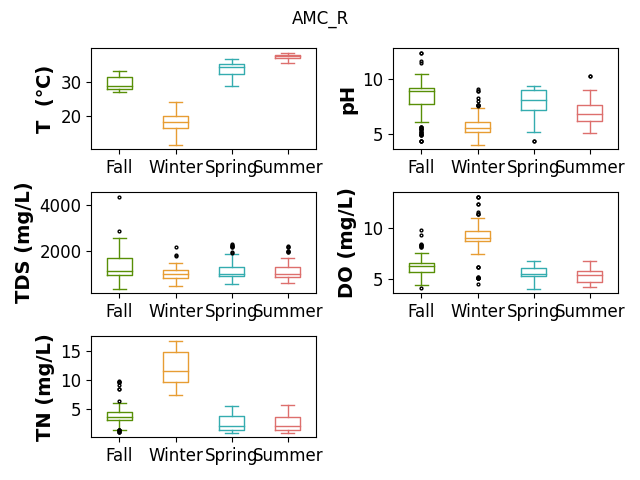
plot_boxplot(feature, 'R', save=SAVE)
plot_line(feature, 'S', save=SAVE)
plot_boxplot(feature, 'S', save=SAVE)
plot_line(feature, 'I', save=SAVE)
#hlot_boxplot(feature, 'I')
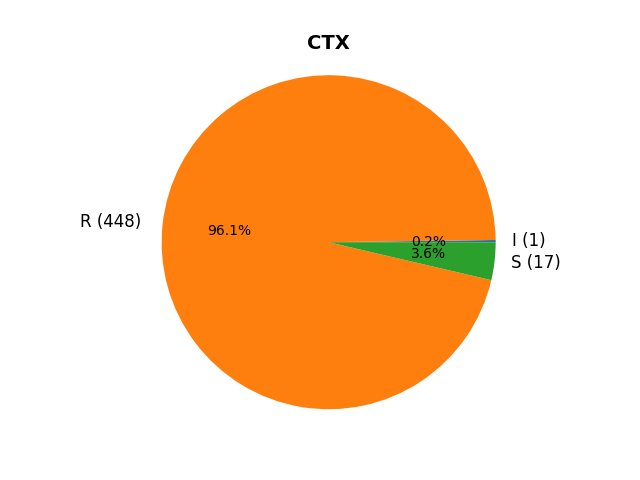
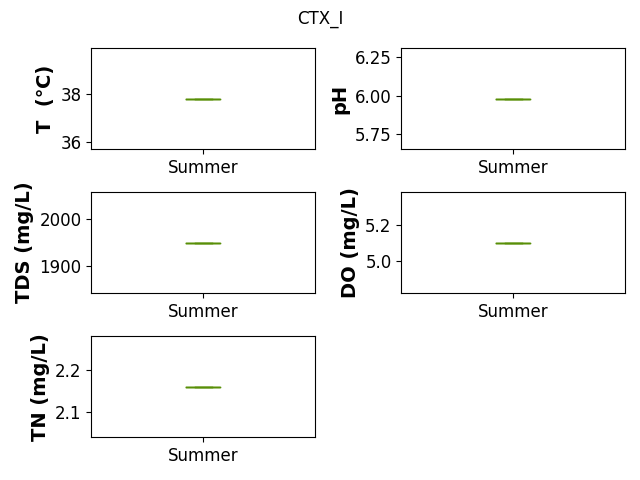
CTX
feature = 'CTX'

print(f'unique values in {feature}: {data[feature].unique()}')
unique values in CTX: ['R' 'S' 'I']
_ = pie(data[feature].values, ax_kws=dict(title=feature), show=False)
if SAVE:
    plt.savefig(f"results/figures/pie_{feature}.png", bbox_inches="tight", dpi=600)
plt.show()
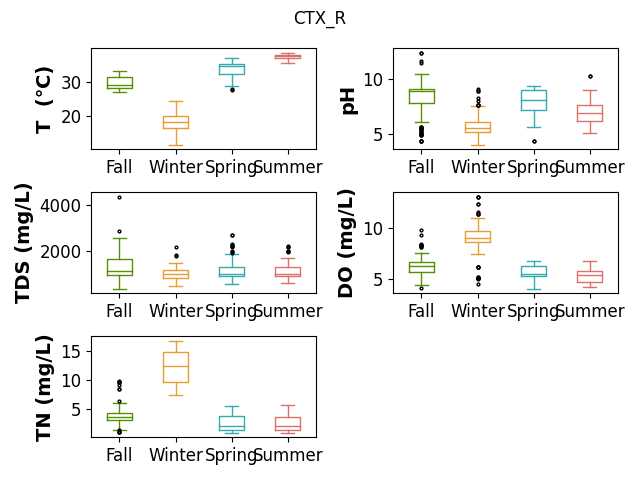
plot_line(feature, 'R', save=SAVE)

plot_boxplot(feature, 'R', save=SAVE)
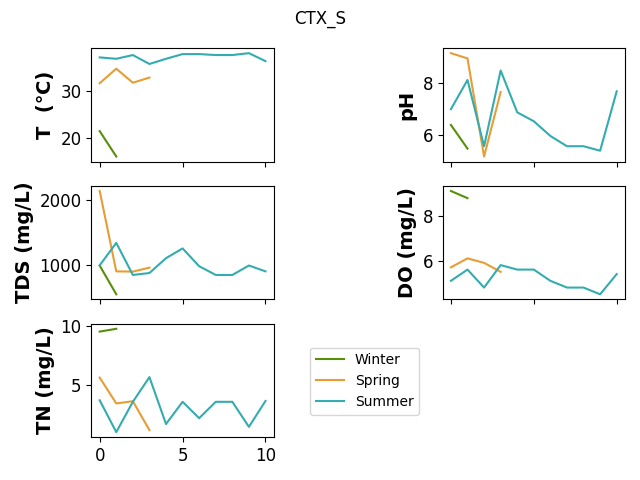
plot_line(feature, 'S', save=SAVE)
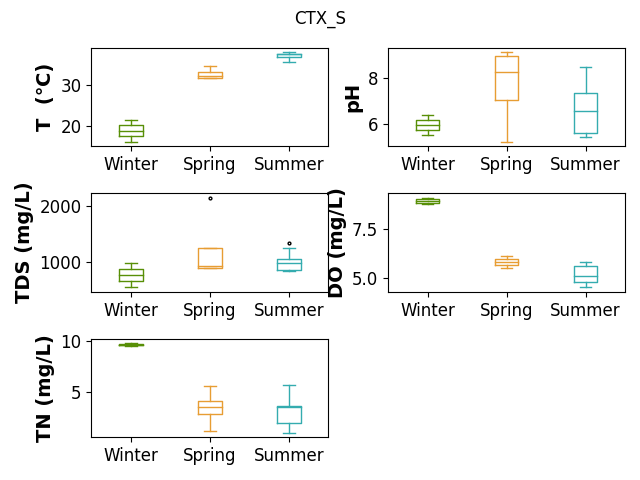
plot_boxplot(feature, 'S', save=SAVE)
plot_line(feature, 'I', save=SAVE)
plot_boxplot(feature, 'I', save=SAVE)
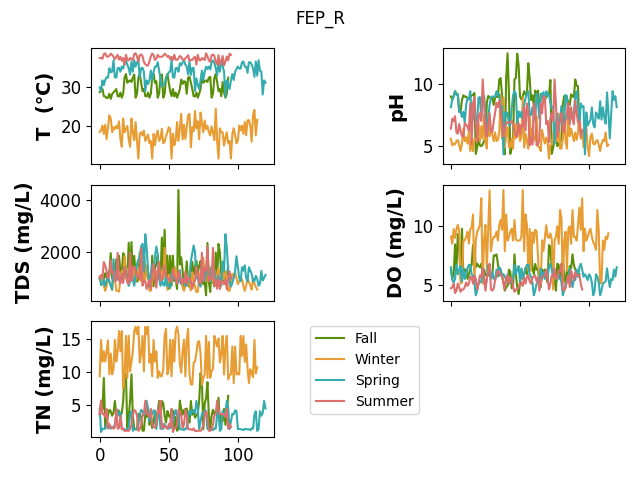
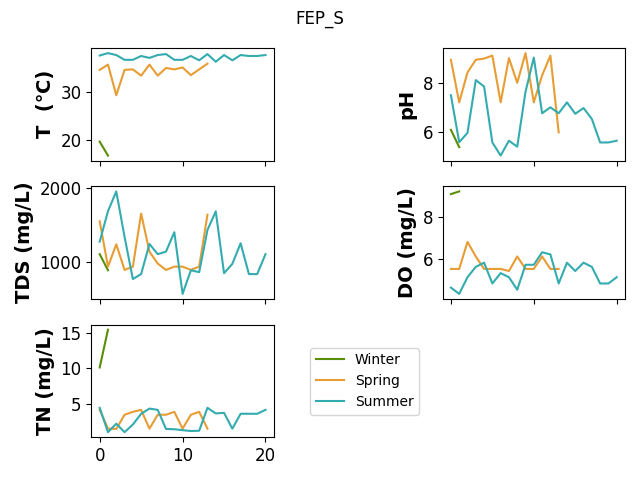
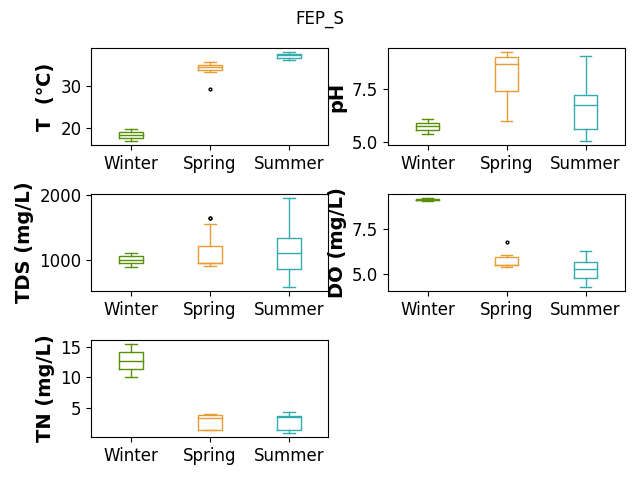
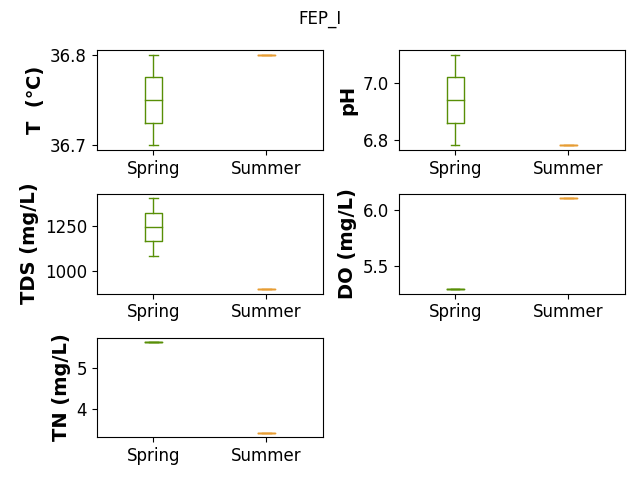
FEP
feature = 'FEP'

print(f'unique values in {feature}: {data[feature].unique()}')
unique values in FEP: ['R' 'S' 'I']
_ = pie(data[feature].values, ax_kws=dict(title=feature), show=False)
if SAVE:
    plt.savefig(f"results/figures/pie_{feature}.png", bbox_inches="tight", dpi=600)
plt.show()

plot_line(feature, 'R', save=SAVE)
plot_boxplot(feature, 'R', save=SAVE)

plot_line(feature, 'S', save=SAVE)
plot_boxplot(feature, 'S', save=SAVE)
plot_line(feature, 'I', save=SAVE)
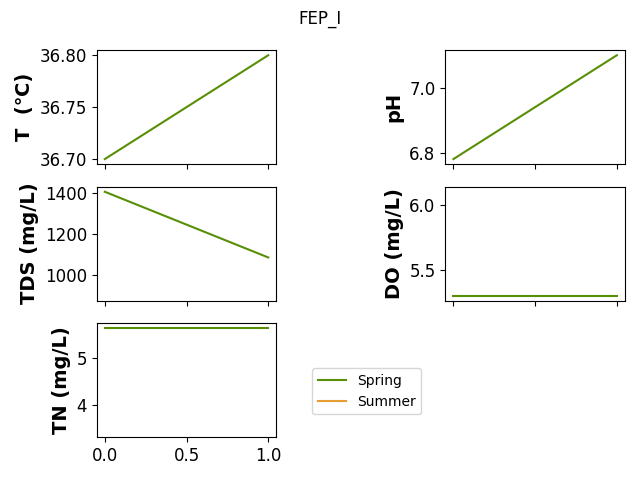
plot_boxplot(feature, 'I', save=SAVE)
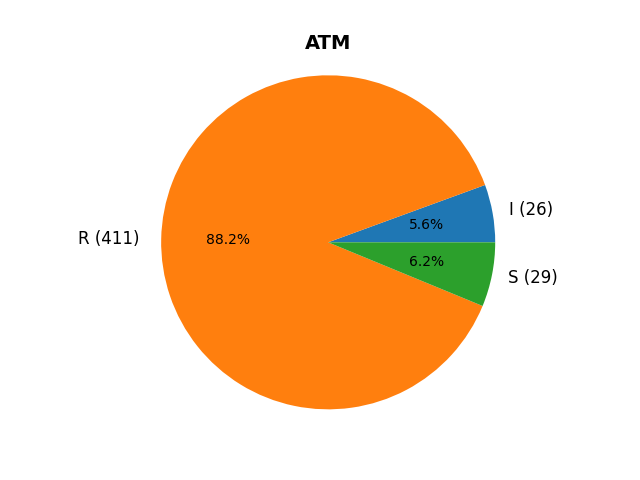
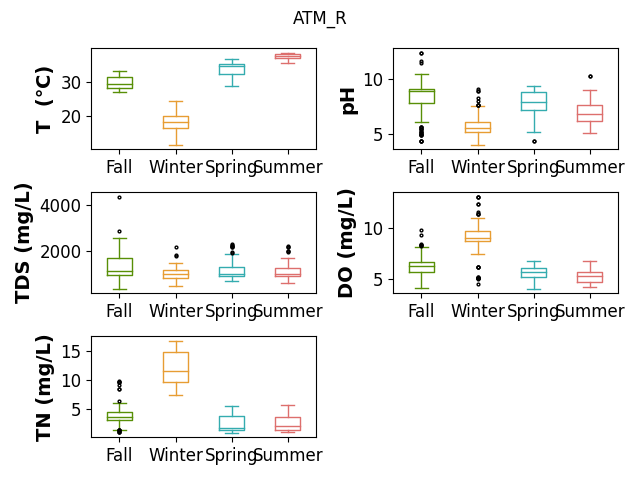
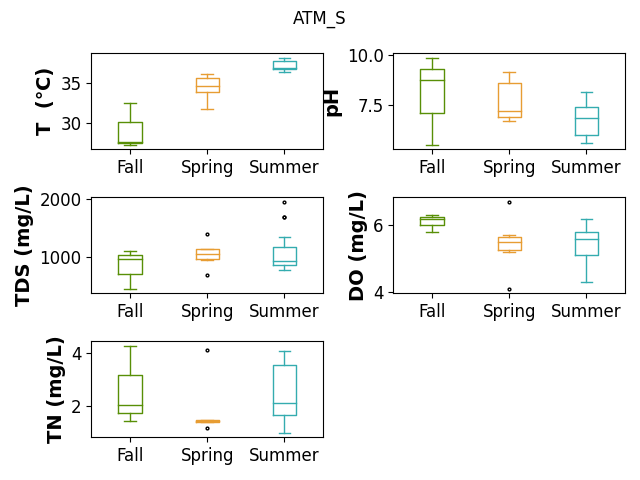
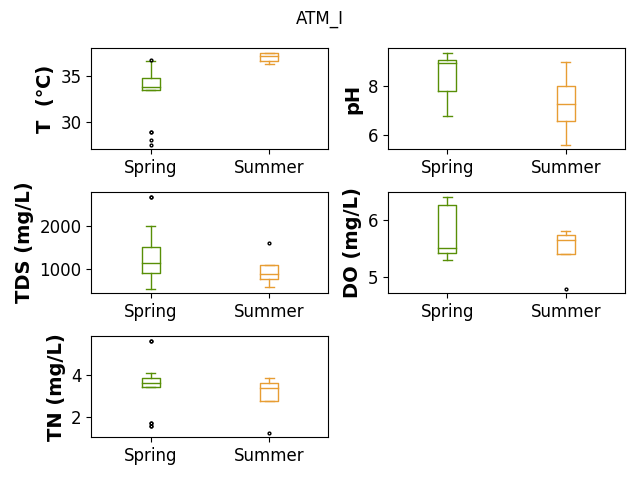
ATM
feature = 'ATM'

print(f'unique values in {feature}: {data[feature].unique()}')
unique values in ATM: ['R' 'S' 'I']
_ = pie(data[feature].values, ax_kws=dict(title=feature), show=False)
if SAVE:
    plt.savefig(f"results/figures/pie_{feature}.png", bbox_inches="tight", dpi=600)
plt.show()
plot_line(feature, 'R', save=SAVE)

plot_boxplot(feature, 'R', save=SAVE)
plot_line(feature, 'S', save=SAVE)
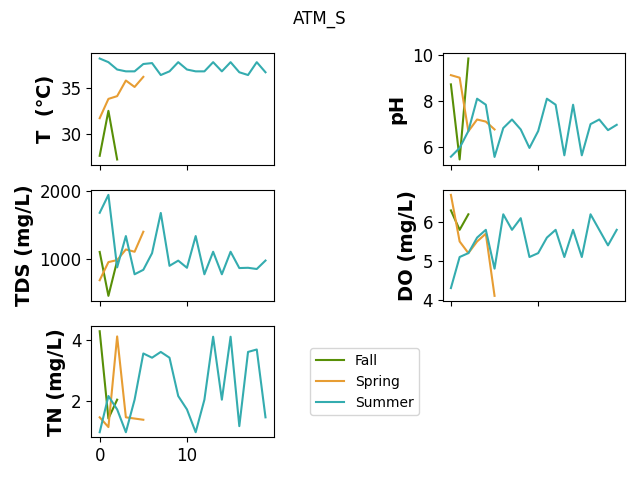
plot_boxplot(feature, 'S', save=SAVE)
plot_line(feature, 'I', save=SAVE)
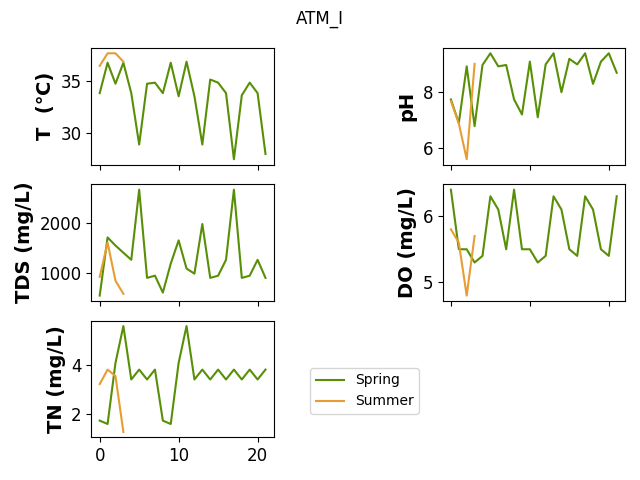
plot_boxplot(feature, 'I', save=SAVE)
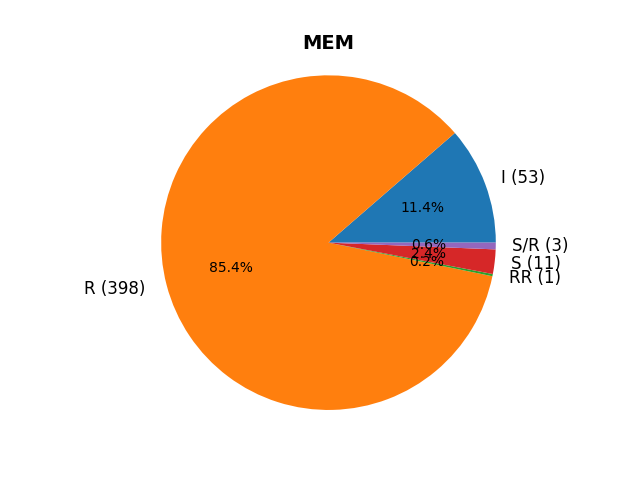
MEM
feature = 'MEM'

print(f'unique values in {feature}: {data[feature].unique()}')
unique values in MEM: ['R' 'S' 'I' 'RR' 'S/R']
_ = pie(data[feature].values, ax_kws=dict(title=feature), show=False)
if SAVE:
    plt.savefig(f"results/figures/pie_{feature}.png", bbox_inches="tight", dpi=600)
plt.show()
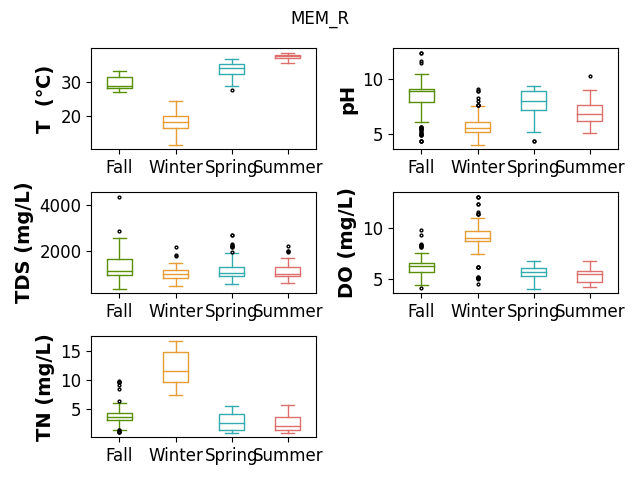
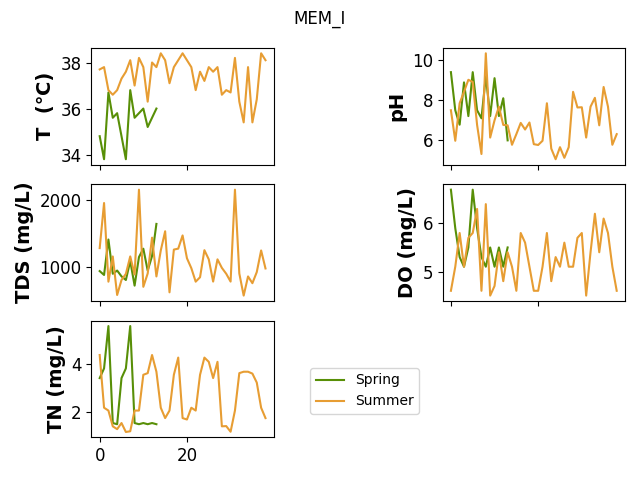
plot_line(feature, 'R', save=SAVE)

plot_boxplot(feature, 'R', save=SAVE)
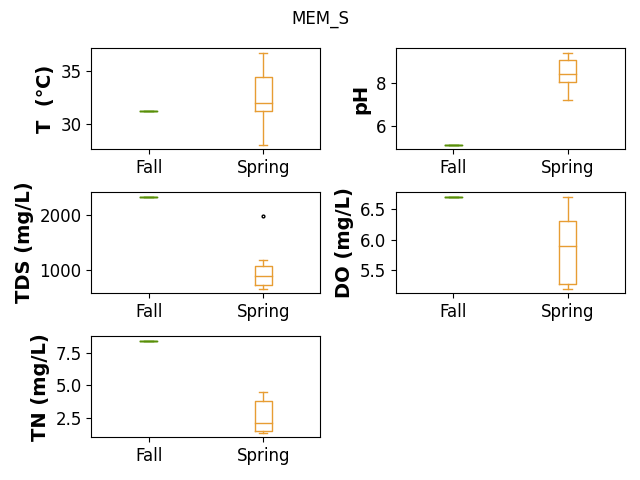
plot_line(feature, 'S', save=SAVE)
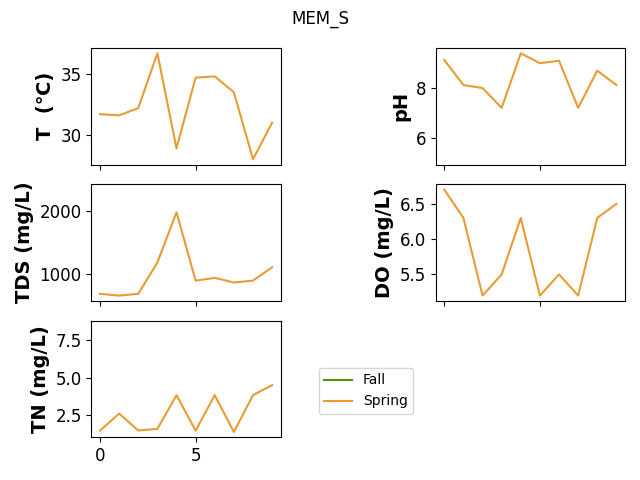
plot_boxplot(feature, 'S', save=SAVE)
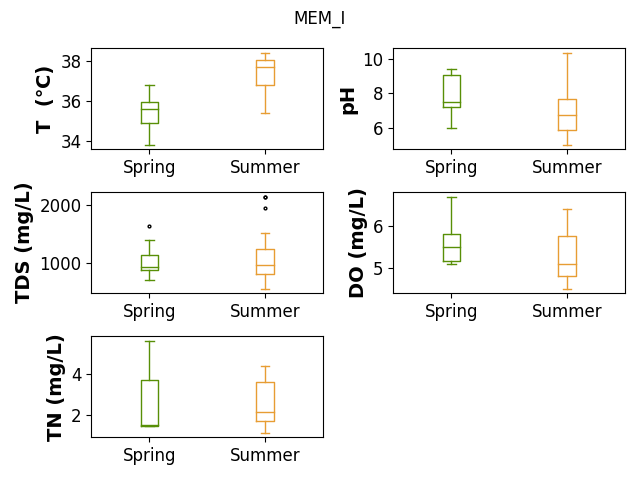
plot_line(feature, 'I', save=SAVE)
plot_boxplot(feature, 'I', save=SAVE)
plot_line(feature, 'S/R', save=SAVE)
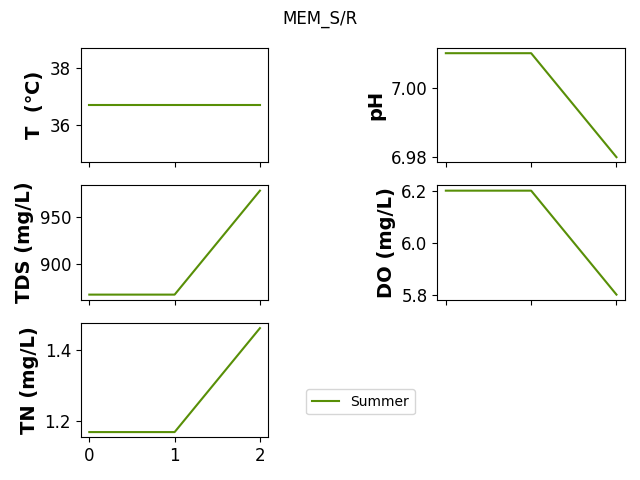
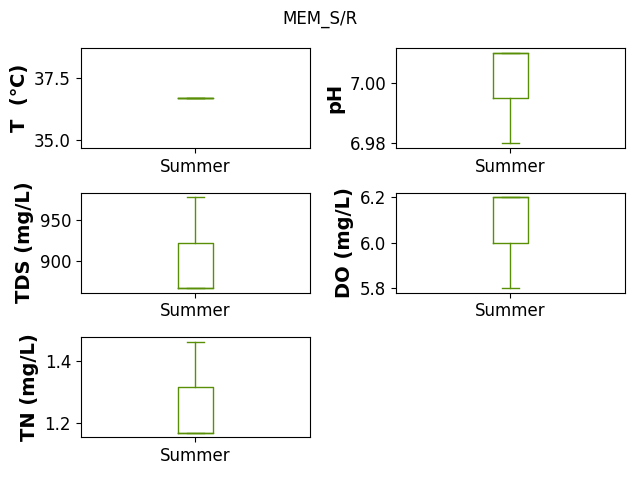
plot_boxplot(feature, 'S/R', save=SAVE)
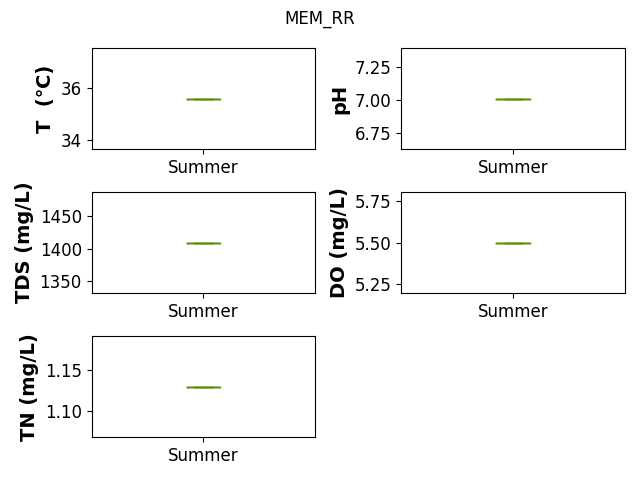
plot_line(feature, 'RR', save=SAVE)
plot_boxplot(feature, 'RR', save=SAVE)
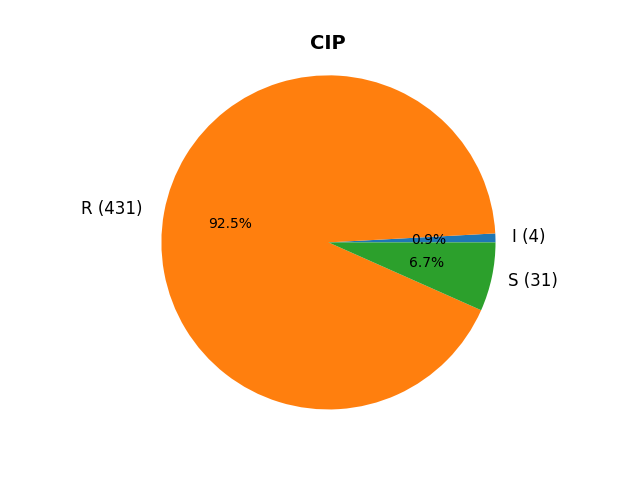
CIP
feature = 'CIP'

print(f'unique values in {feature}: {data[feature].unique()}')
unique values in CIP: ['R' 'S' 'I']
_ = pie(data[feature].values, ax_kws=dict(title=feature), show=False)
if SAVE:
    plt.savefig(f"results/figures/pie_{feature}.png", bbox_inches="tight", dpi=600)
plt.show()
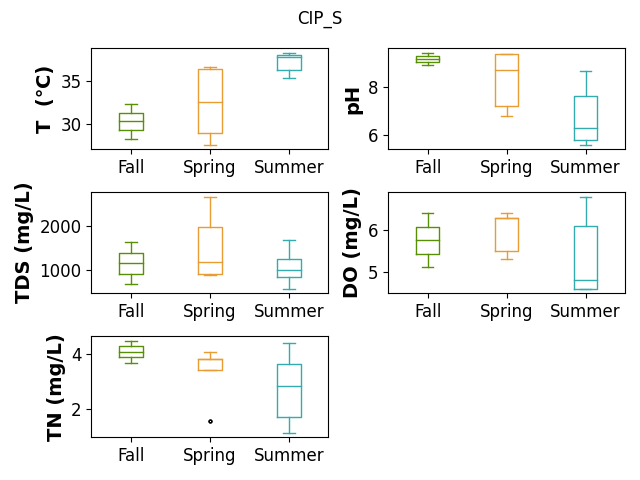
plot_line(feature, 'R', save=SAVE)

plot_boxplot(feature, 'R', save=SAVE)

plot_line(feature, 'S', save=SAVE)
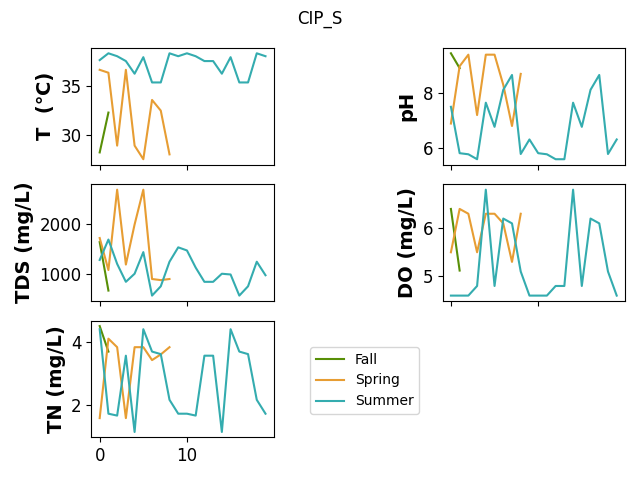
plot_boxplot(feature, 'S', save=SAVE)
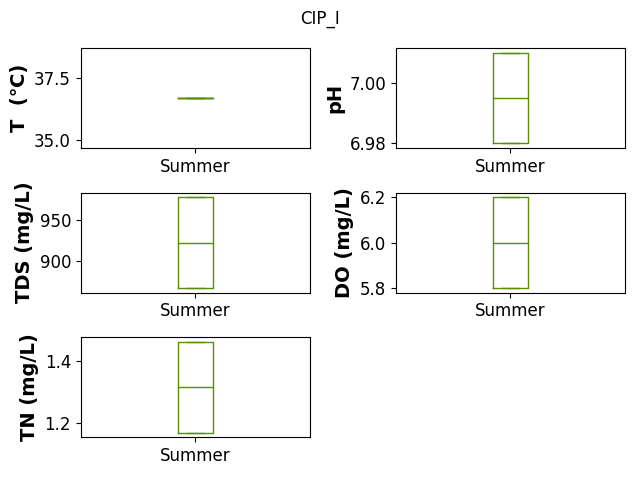
plot_line(feature, 'I', save=SAVE)
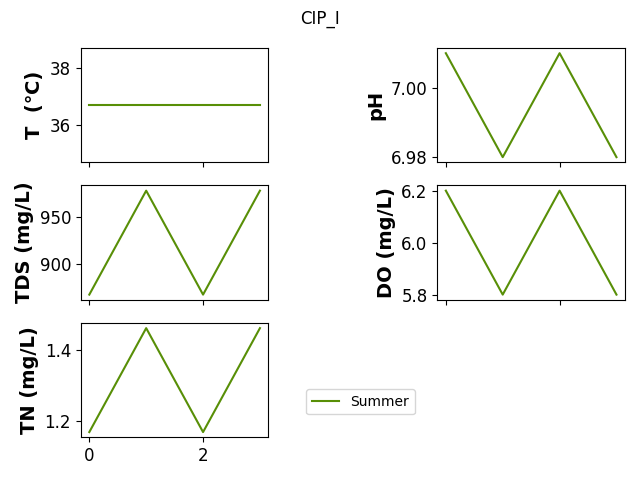
plot_boxplot(feature, 'I', save=SAVE)
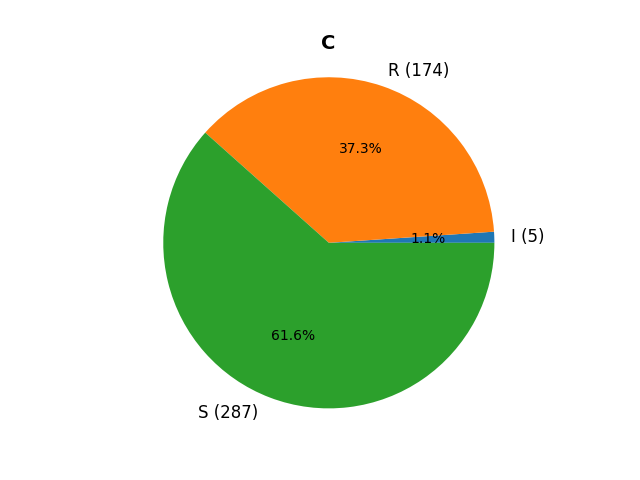
C
feature = 'C'

print(f'unique values in {feature}: {data[feature].unique()}')
unique values in C: ['S' 'R' 'I']
_ = pie(data[feature].values, ax_kws=dict(title=feature), show=False)
if SAVE:
    plt.savefig(f"results/figures/pie_{feature}.png", bbox_inches="tight", dpi=600)
plt.show()
plot_line(feature, 'R', save=SAVE)
plot_boxplot(feature, 'R', save=SAVE)
plot_line(feature, 'S', save=SAVE)
plot_boxplot(feature, 'S', save=SAVE)
plot_line(feature, 'I', save=SAVE)
plot_boxplot(feature, 'I', save=SAVE)
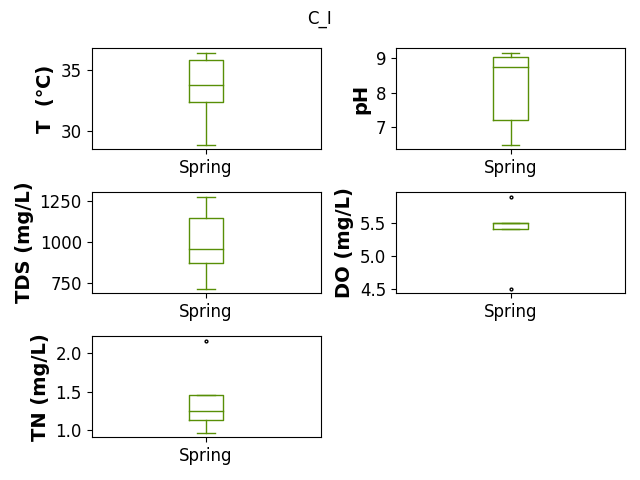
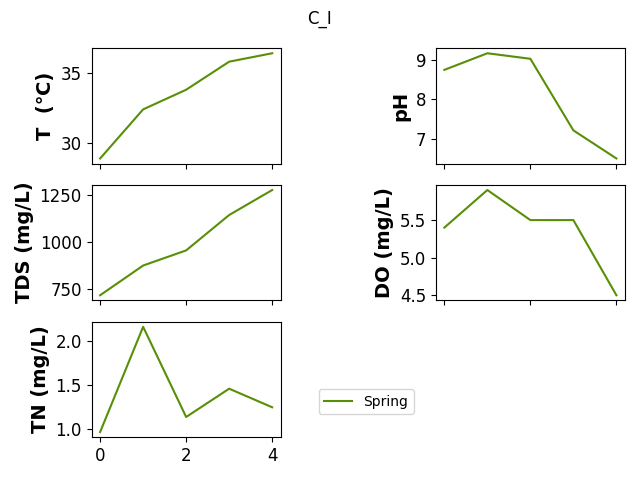
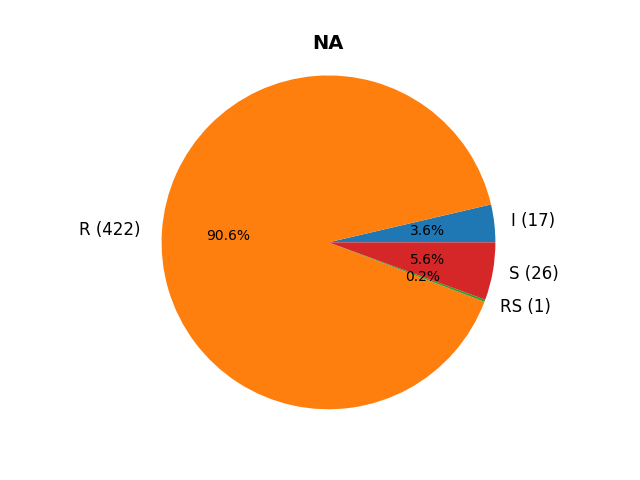
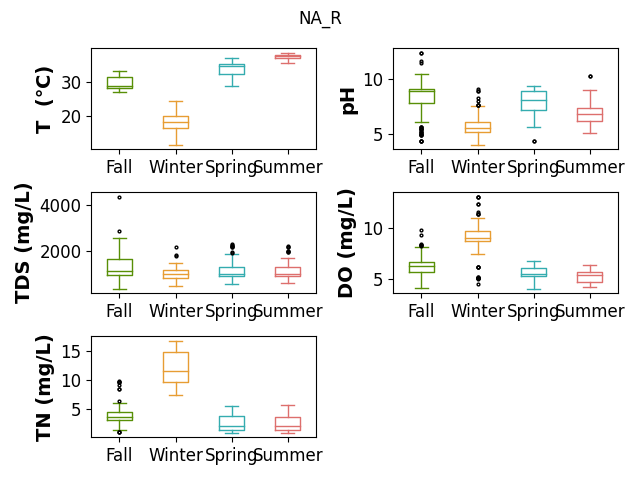
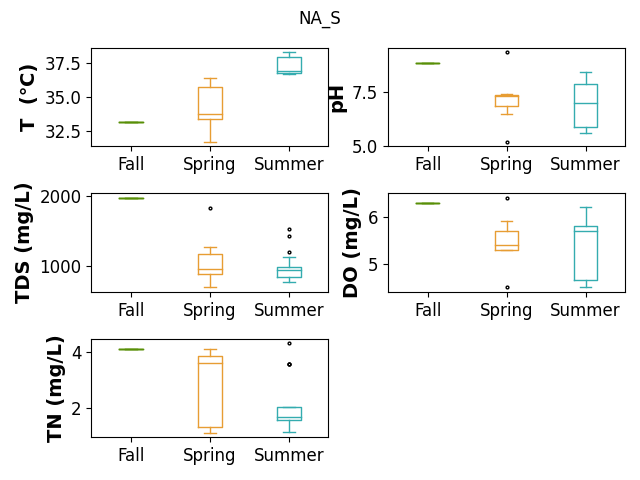
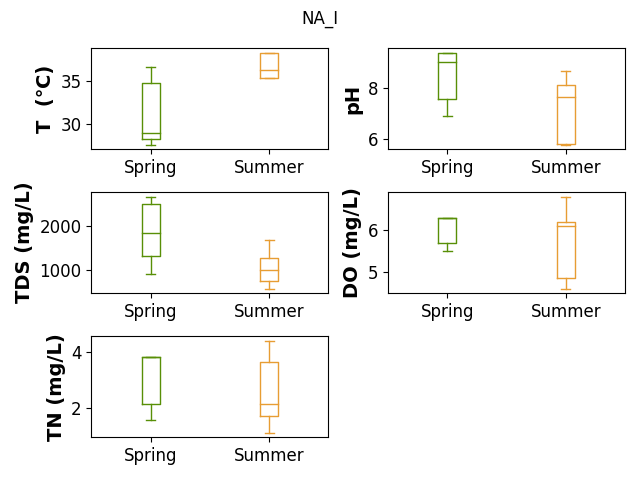
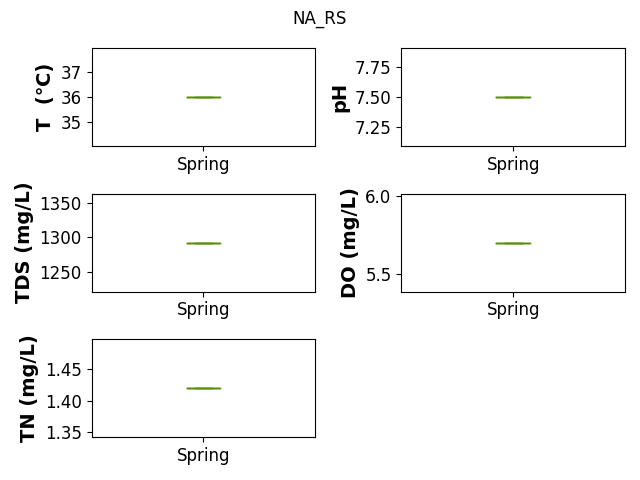
NA
feature = 'NA'

print(f'unique values in {feature}: {data[feature].unique()}')
unique values in NA: ['R' 'S' 'I' 'RS']
_ = pie(data[feature].values,  ax_kws=dict(title=feature), show=False)
if SAVE:
    plt.savefig(f"results/figures/pie_{feature}.png", bbox_inches="tight", dpi=600)
plt.show()
plot_line(feature, 'R', save=SAVE)

plot_boxplot(feature, 'R', save=SAVE)
plot_line(feature, 'S', save=SAVE)
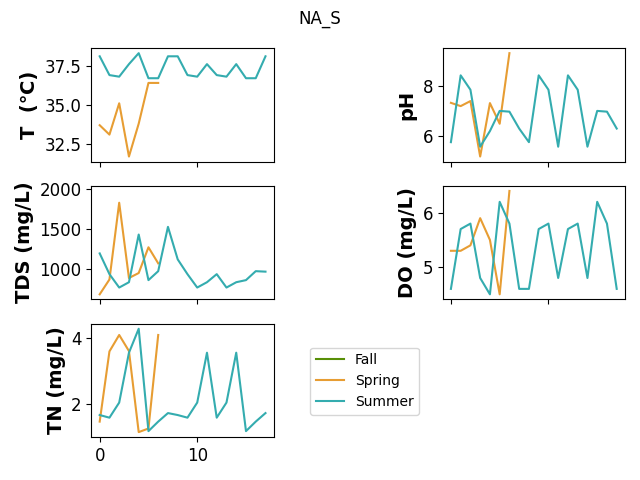
plot_boxplot(feature, 'S', save=SAVE)
plot_line(feature, 'I', save=SAVE)
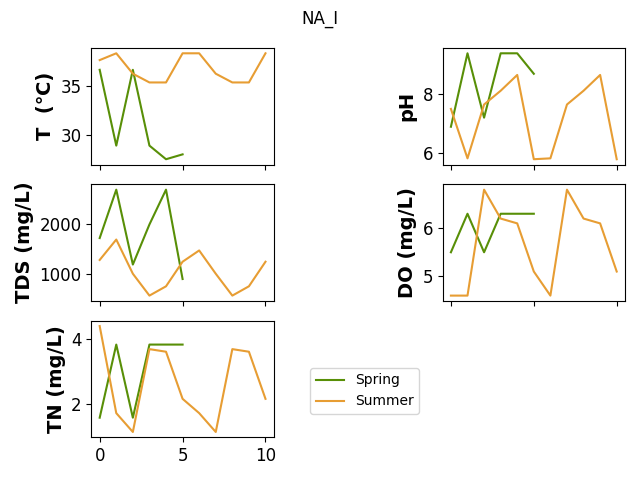
plot_boxplot(feature, 'I', save=SAVE)
plot_line(feature, 'RS', save=SAVE)
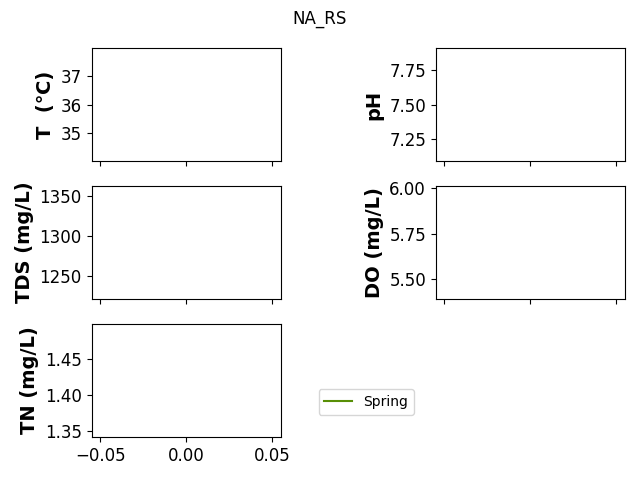
plot_boxplot(feature, 'RS', save=SAVE)
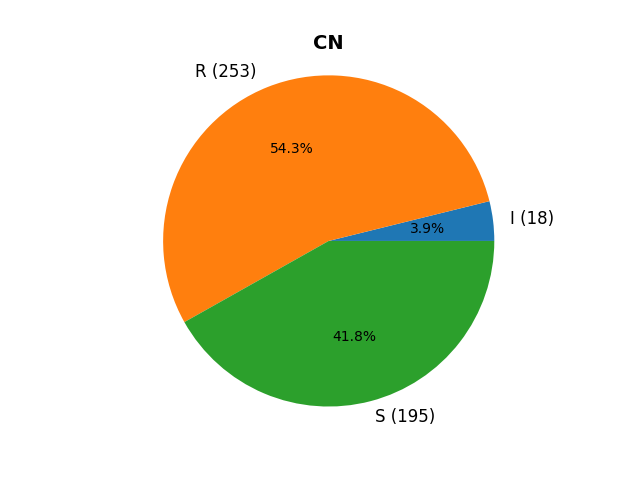
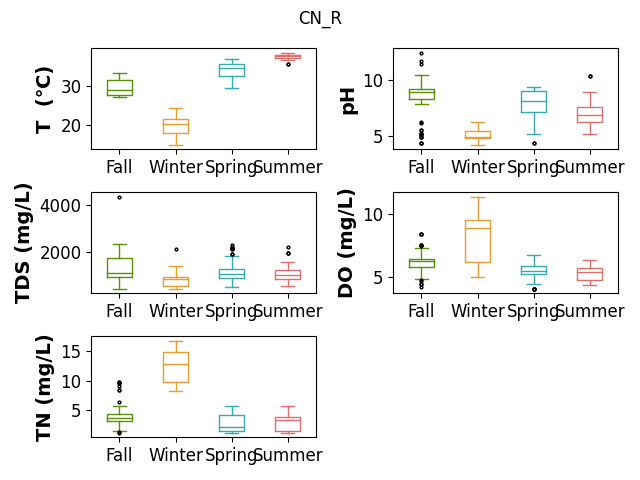
CN
feature = 'CN'

print(f'unique values in {feature}: {data[feature].unique()}')
unique values in CN: ['S' 'R' 'I']
_ = pie(data[feature].values, ax_kws=dict(title=feature), show=False)
if SAVE:
    plt.savefig(f"results/figures/pie_{feature}.png", bbox_inches="tight", dpi=600)
plt.show()
plot_line(feature, 'R', save=SAVE)
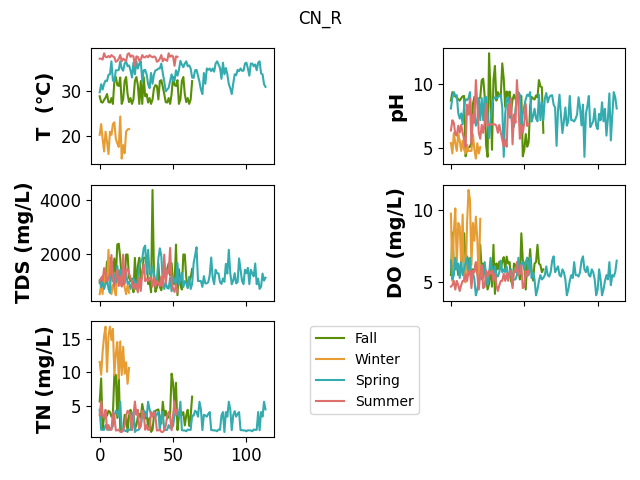
plot_boxplot(feature, 'R', save=SAVE)
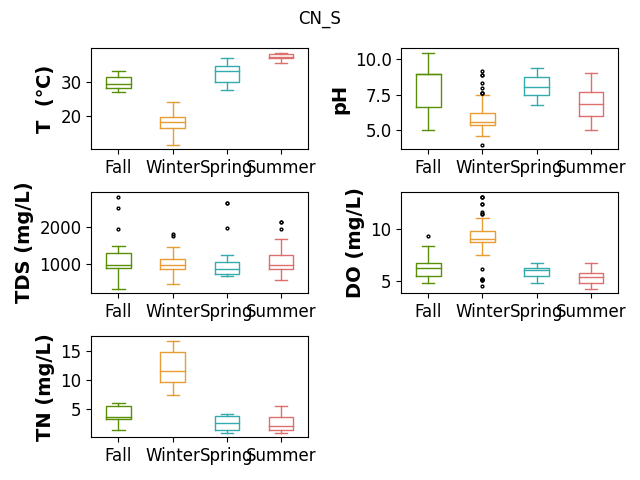
plot_line(feature, 'S', save=SAVE)
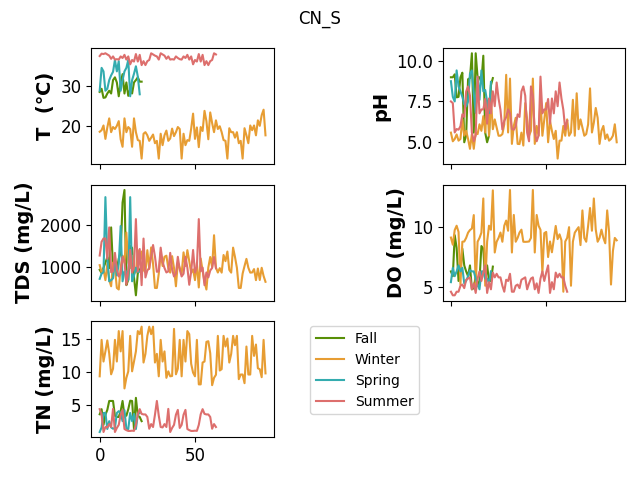
plot_boxplot(feature, 'S', save=SAVE)
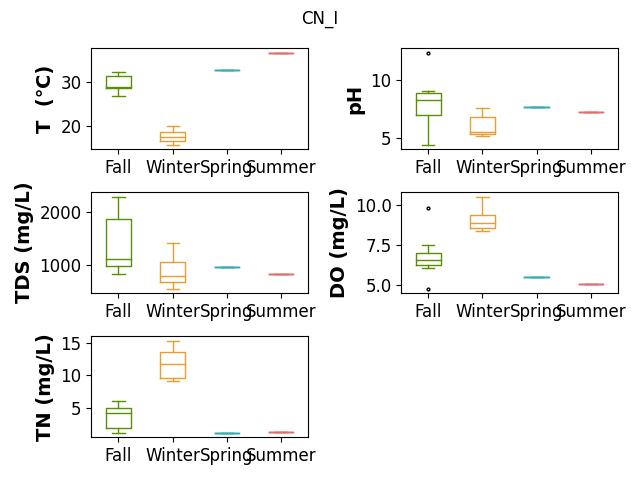
plot_line(feature, 'I', save=SAVE)
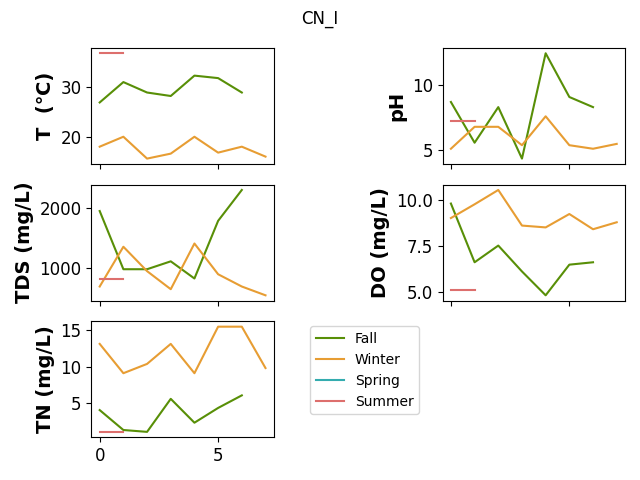
plot_boxplot(feature, 'I', save=SAVE)
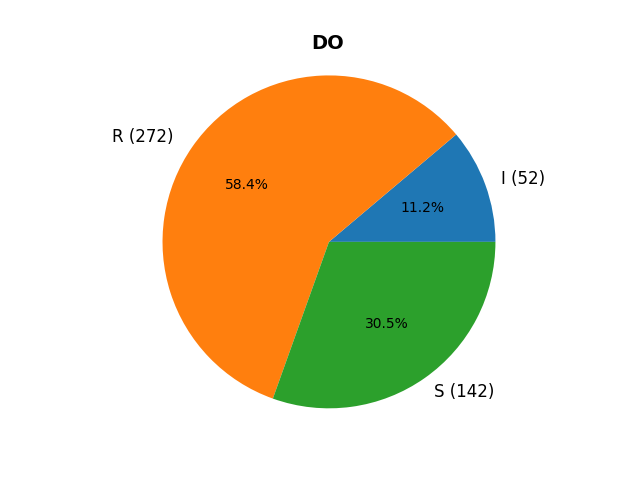
DO
feature = 'DO'

print(f'unique values in {feature}: {data[feature].unique()}')
unique values in DO: ['R' 'I' 'S']
_ = pie(data[feature].values, ax_kws=dict(title=feature), show=False)
if SAVE:
    plt.savefig(f"results/figures/pie_{feature}.png", bbox_inches="tight", dpi=600)
plt.show()
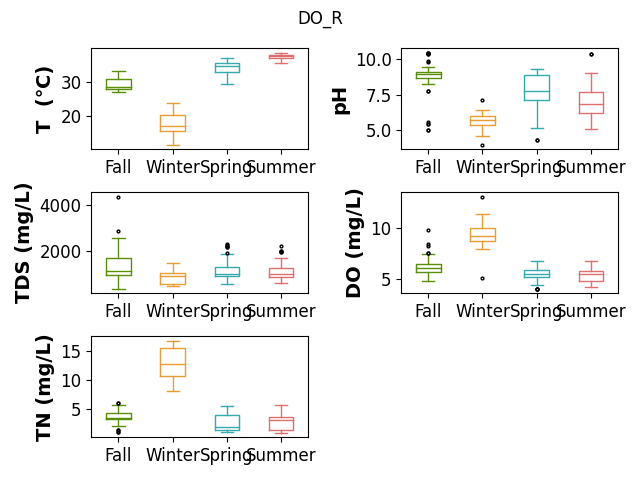
plot_line(feature, 'R', save=SAVE)
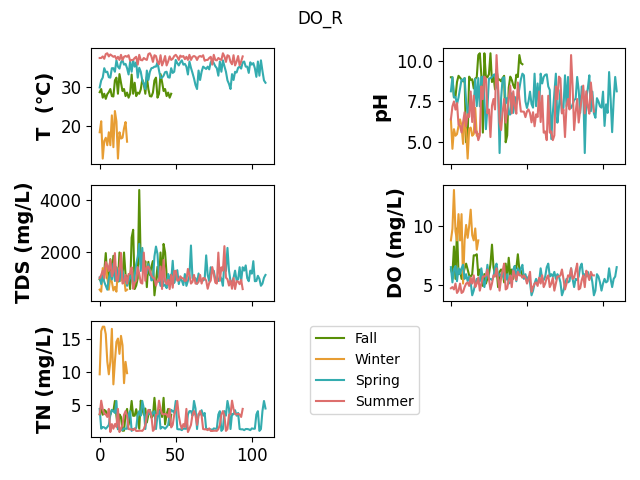
plot_boxplot(feature, 'R', save=SAVE)
plot_line(feature, 'S', save=SAVE)
plot_boxplot(feature, 'S', save=SAVE)
plot_line(feature, 'I', save=SAVE)
plot_boxplot(feature, 'I', save=SAVE)
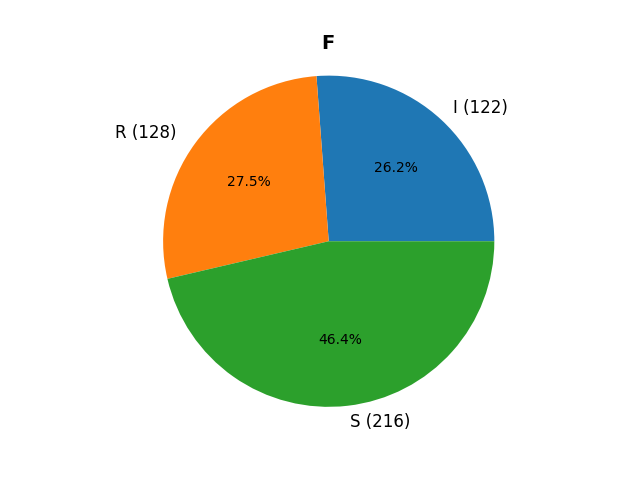
F
feature = 'F'

print(f'unique values in {feature}: {data[feature].unique()}')
unique values in F: ['S' 'I' 'R']
_ = pie(data[feature].values, ax_kws=dict(title=feature), show=False)
if SAVE:
    plt.savefig(f"results/figures/pie_{feature}.png", bbox_inches="tight", dpi=600)
plt.show()
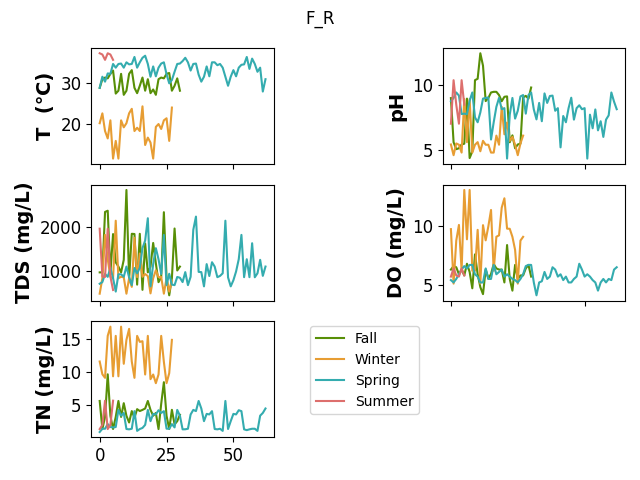
plot_line(feature, 'R', save=SAVE)
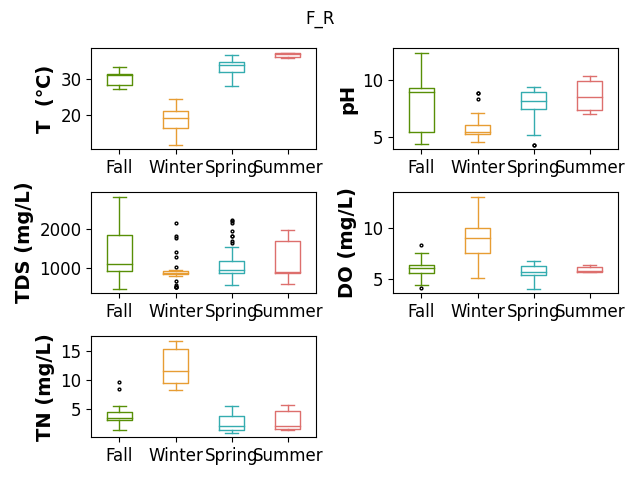
plot_boxplot(feature, 'R', save=SAVE)
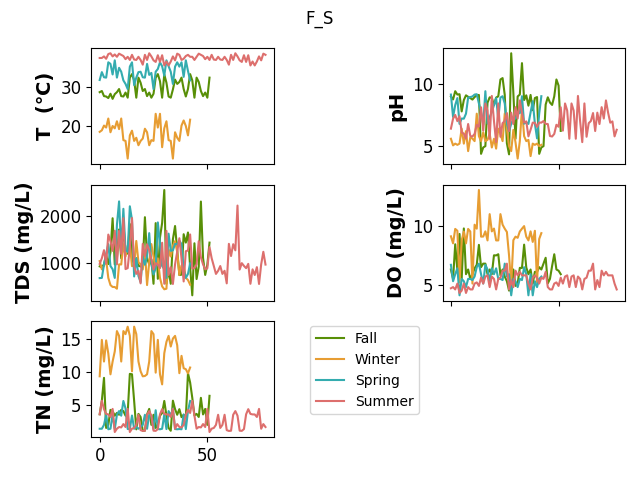
plot_line(feature, 'S', save=SAVE)
plot_boxplot(feature, 'S', save=SAVE)
plot_line(feature, 'I', save=SAVE)
plot_boxplot(feature, 'I', save=SAVE)
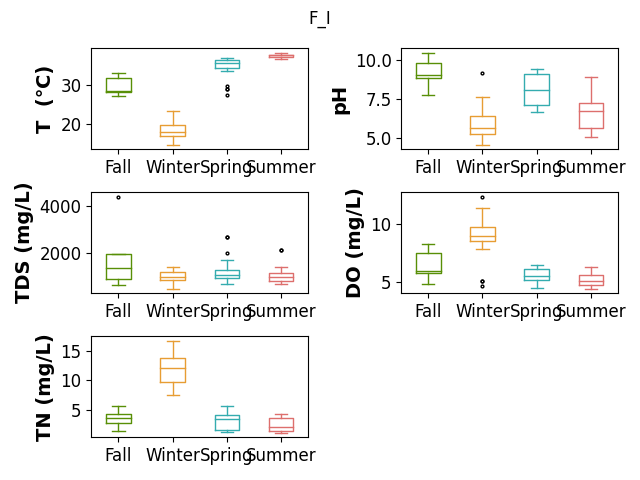
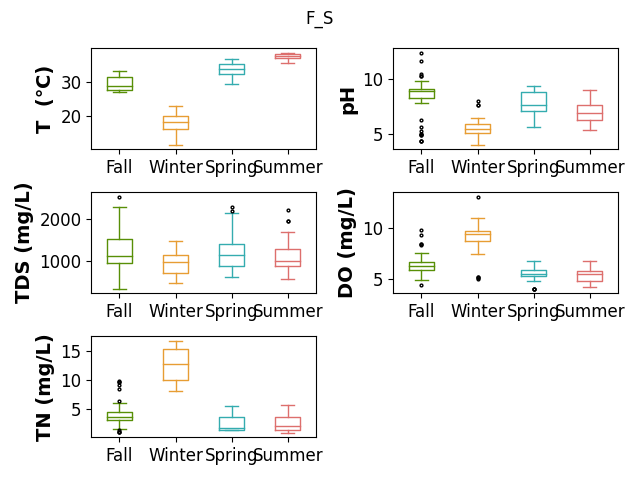
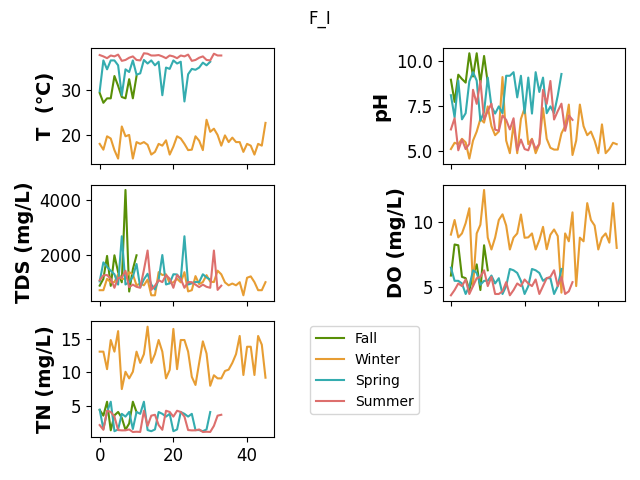
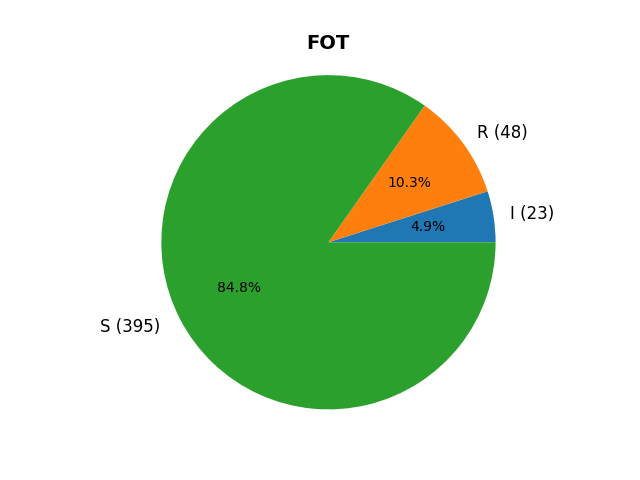
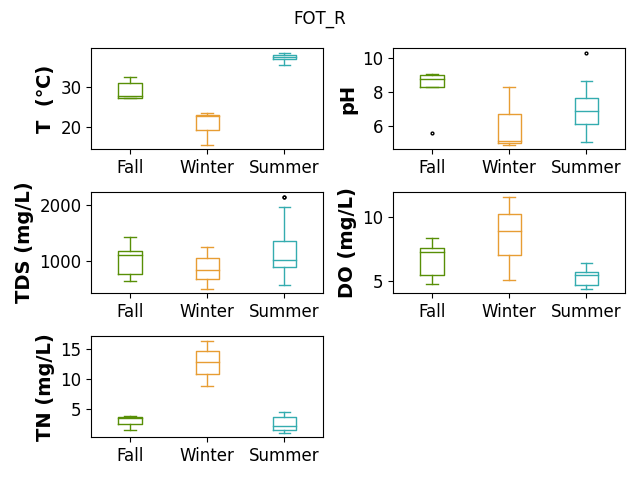
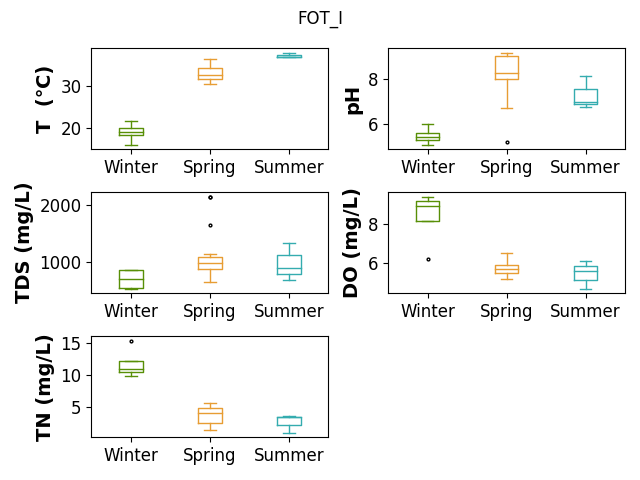
FOT
feature = 'FOT'

print(f'unique values in {feature}: {data[feature].unique()}')
unique values in FOT: ['S' 'R' 'I']
_ = pie(data[feature].values, ax_kws=dict(title=feature), show=False)
if SAVE:
    plt.savefig(f"results/figures/pie_{feature}.png", bbox_inches="tight", dpi=600)
plt.show()
plot_line(feature, 'R', save=SAVE)
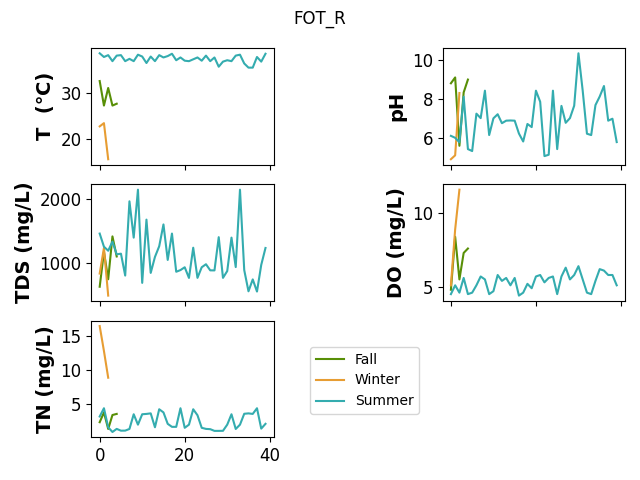
plot_boxplot(feature, 'R', save=SAVE)
plot_line(feature, 'S', save=SAVE)
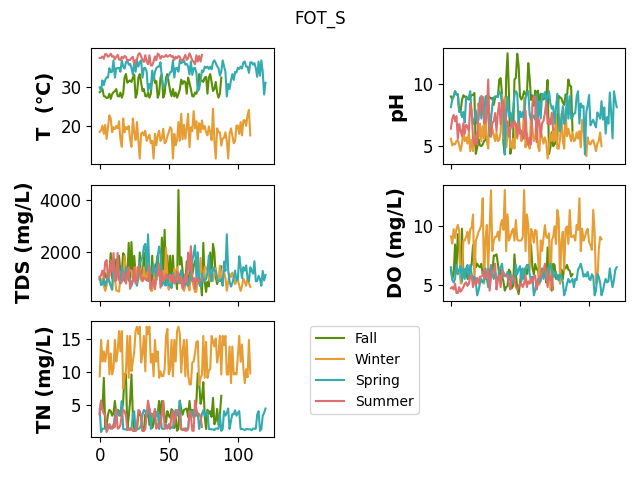
plot_boxplot(feature, 'S', save=SAVE)

plot_line(feature, 'I', save=SAVE)
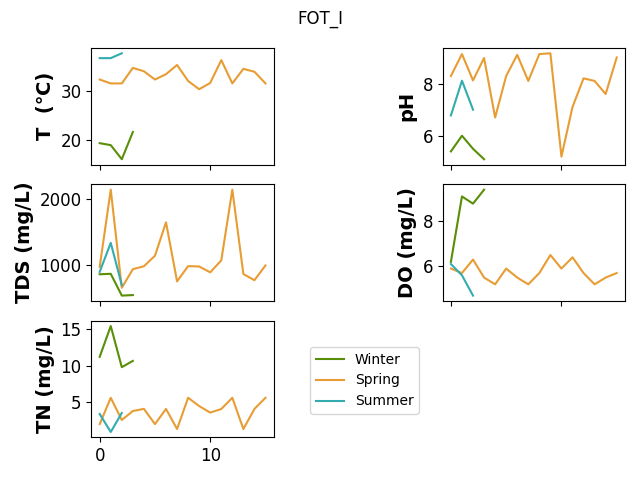
plot_boxplot(feature, 'I', save=SAVE)
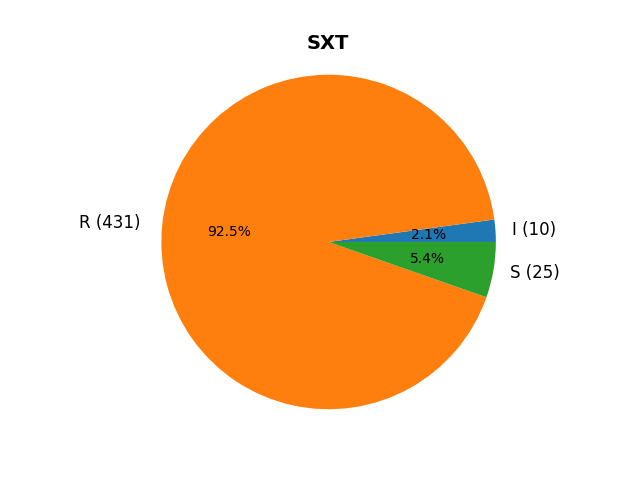
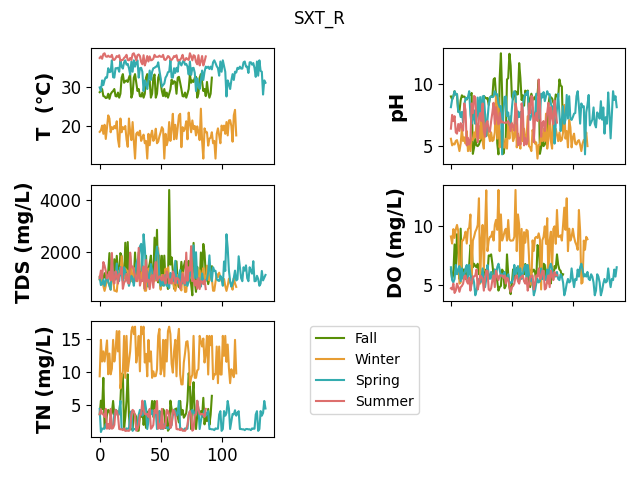
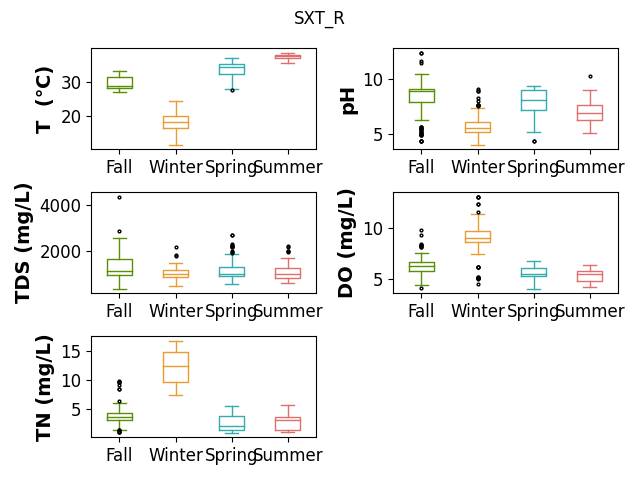
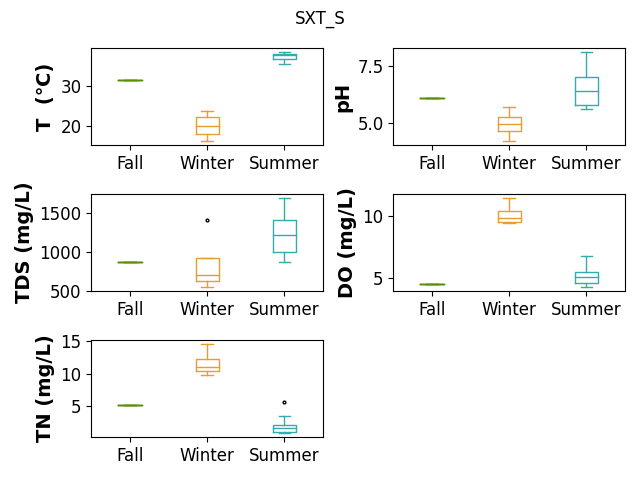
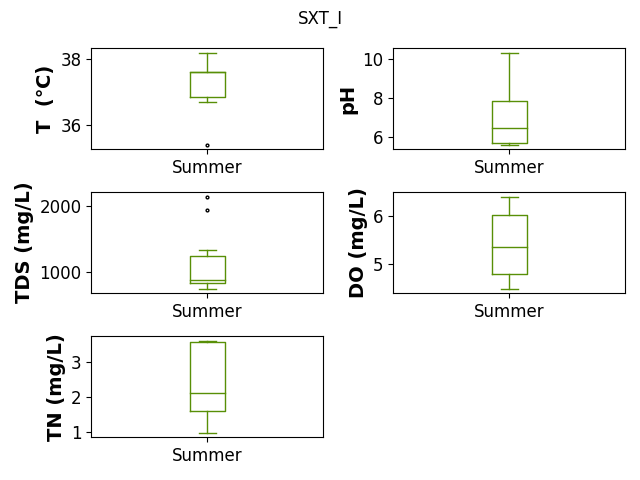
SXT
feature = 'SXT'

print(f'unique values in {feature}: {data[feature].unique()}')
unique values in SXT: ['R' 'S' 'I']
_ = pie(data[feature].values, ax_kws=dict(title=feature), show=False)
if SAVE:
    plt.savefig(f"results/figures/pie_{feature}.png", bbox_inches="tight", dpi=600)
plt.show()
plot_line(feature, 'R', save=SAVE)
plot_boxplot(feature, 'R', save=SAVE)
plot_line(feature, 'S', save=SAVE)
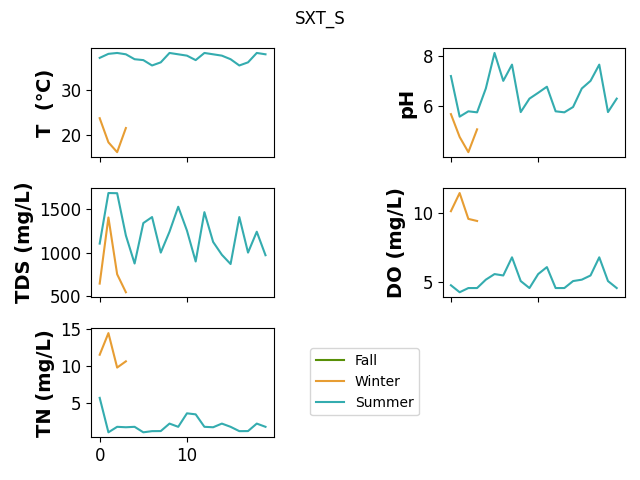
plot_boxplot(feature, 'S', save=SAVE)
plot_line(feature, 'I', save=SAVE)
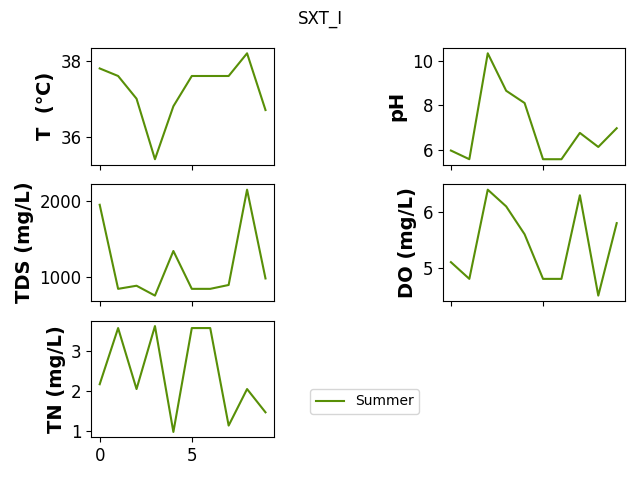
plot_boxplot(feature, 'I', save=SAVE)
Genes
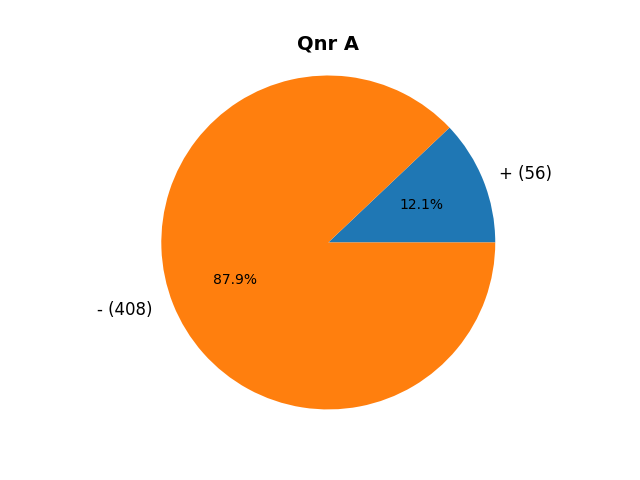
Qnr A
feature = 'Qnr A'

print(f'unique values in {feature}: {data[feature].unique()}')
unique values in Qnr A: ['-' '+' nan]
_ = pie(data[feature].dropna().values, ax_kws=dict(title=feature), show=False)
if SAVE:
    plt.savefig(f"results/figures/pie_{feature}.png", bbox_inches="tight", dpi=600)
plt.show()
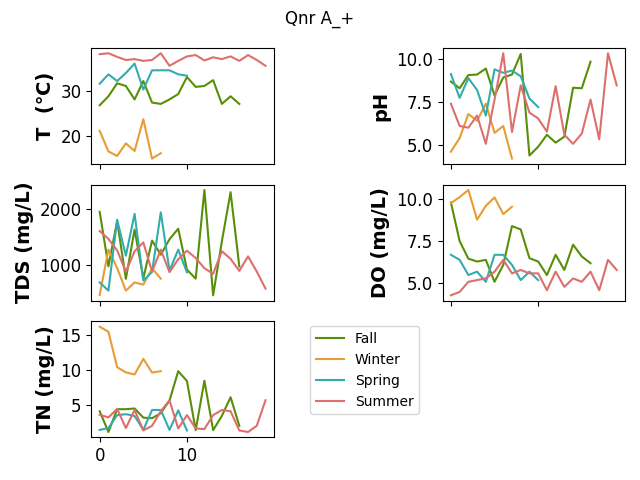
plot_line(feature, '+', save=SAVE)
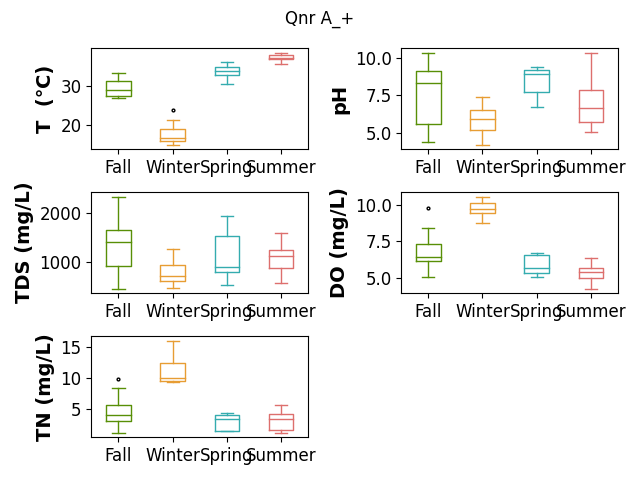
plot_boxplot(feature, '+', save=SAVE)
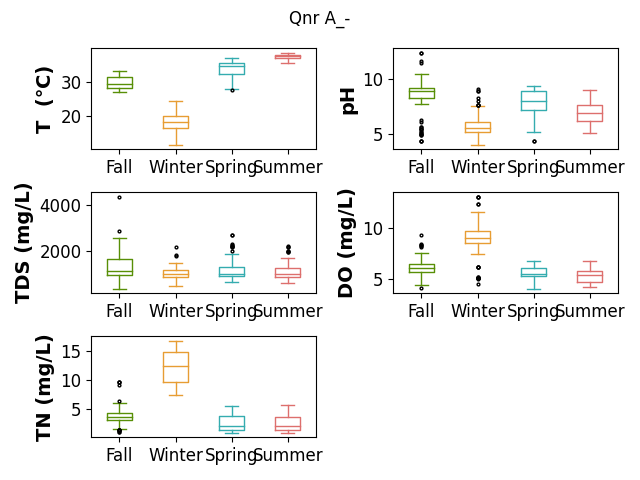
plot_line(feature, '-')
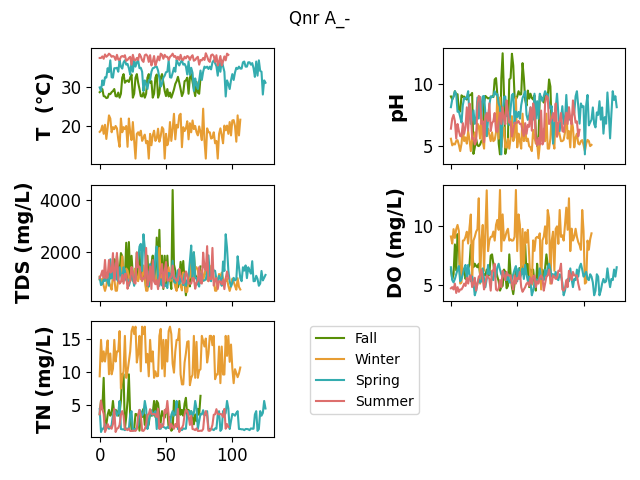
plot_boxplot(feature, '-', save=SAVE)
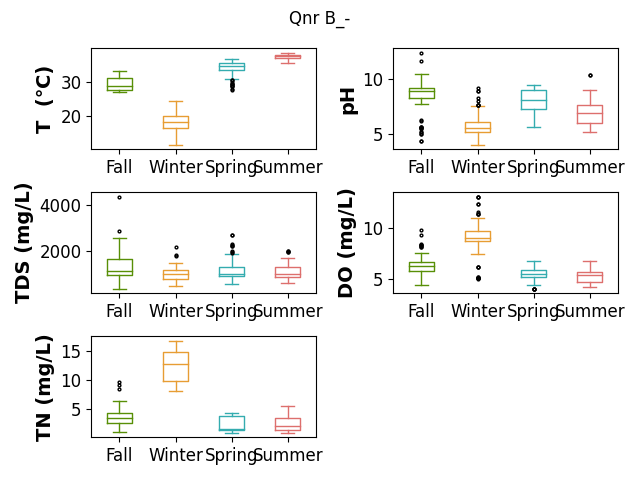
Qnr B
feature = 'Qnr B'

print(f'unique values in {feature}: {data[feature].unique()}')
unique values in Qnr B: ['+' '-']
_ = pie(data[feature].dropna().values, ax_kws=dict(title=feature), show=False)
if SAVE:
    plt.savefig(f"results/figures/pie_{feature}.png", bbox_inches="tight", dpi=600)
plt.show()

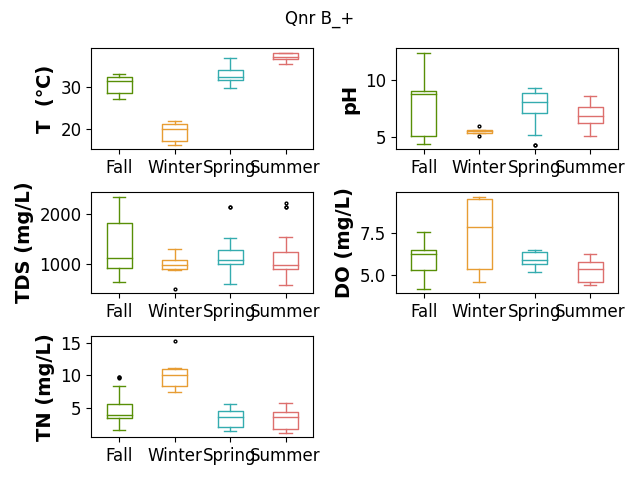
plot_line(feature, '+', save=SAVE)
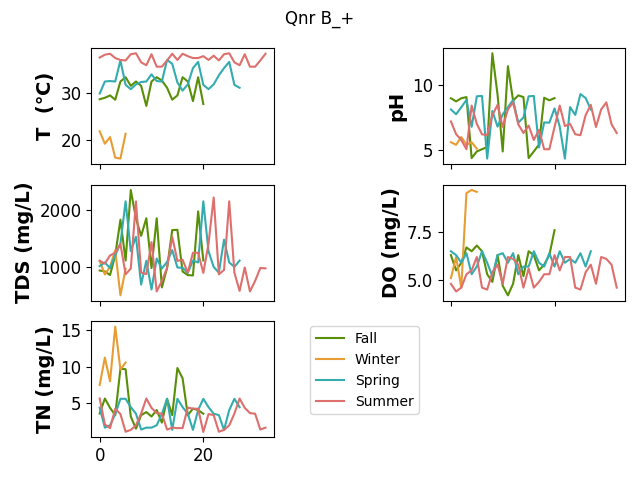
plot_boxplot(feature, '+', save=SAVE)
plot_line(feature, '-')
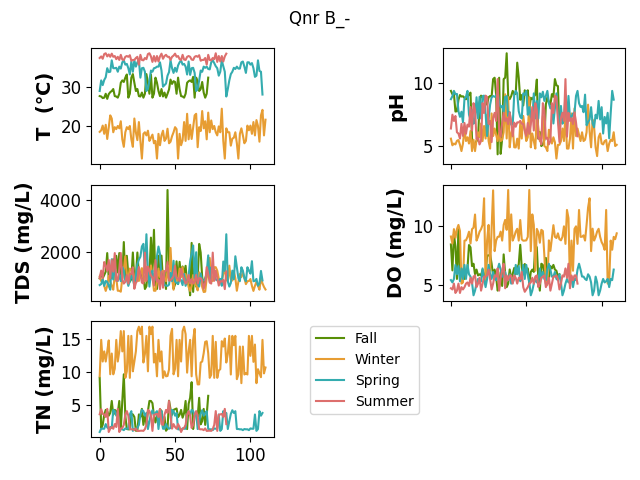
plot_boxplot(feature, '-', save=SAVE)
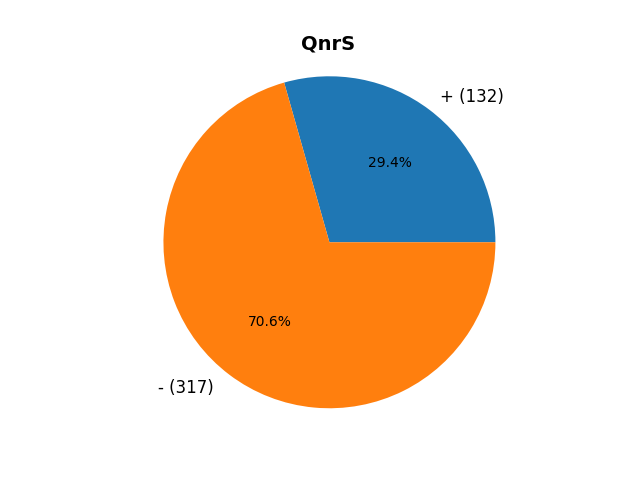
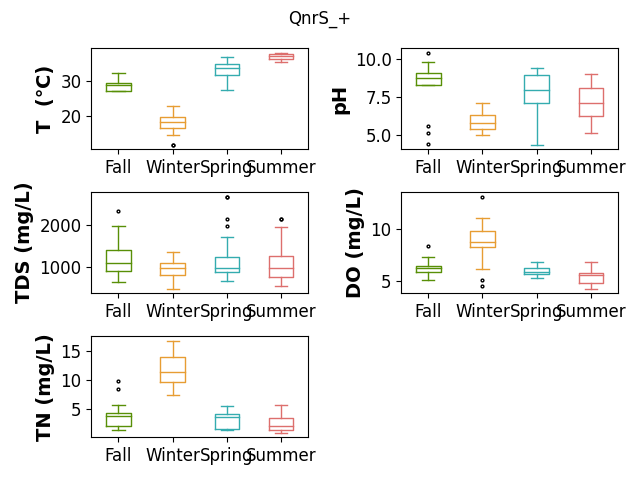
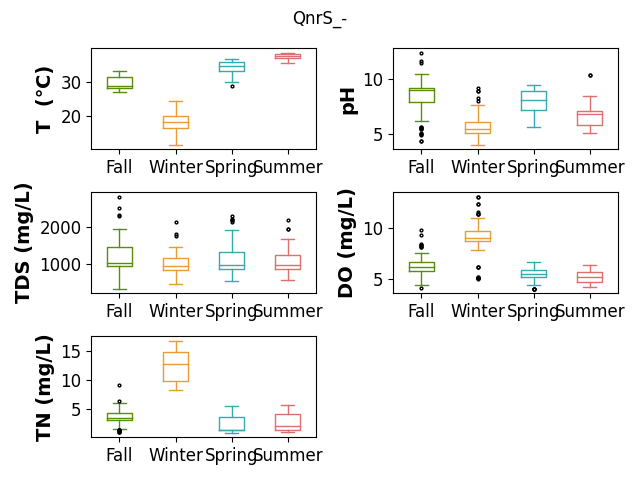
QnrS
feature = 'QnrS'

print(f'unique values in {feature}: {data[feature].unique()}')
unique values in QnrS: ['-' '+' nan]
_ = pie(data[feature].dropna().values, ax_kws=dict(title=feature), show=False)
if SAVE:
    plt.savefig(f"results/figures/pie_{feature}.png", bbox_inches="tight", dpi=600)
plt.show()
plot_line(feature, '+', save=SAVE)
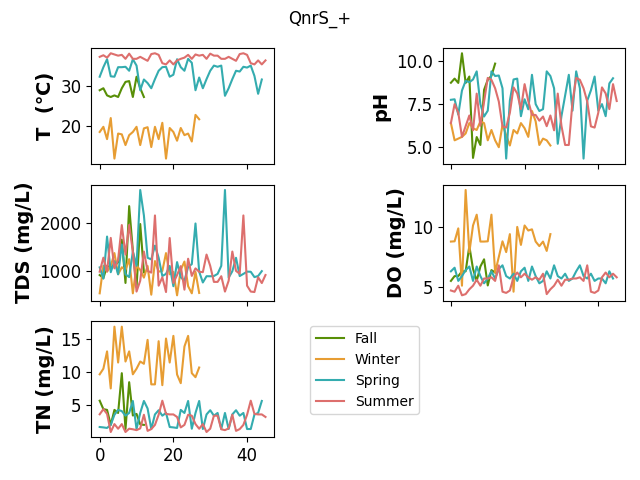
plot_boxplot(feature, '+', save=SAVE)
plot_line(feature, '-', save=SAVE)
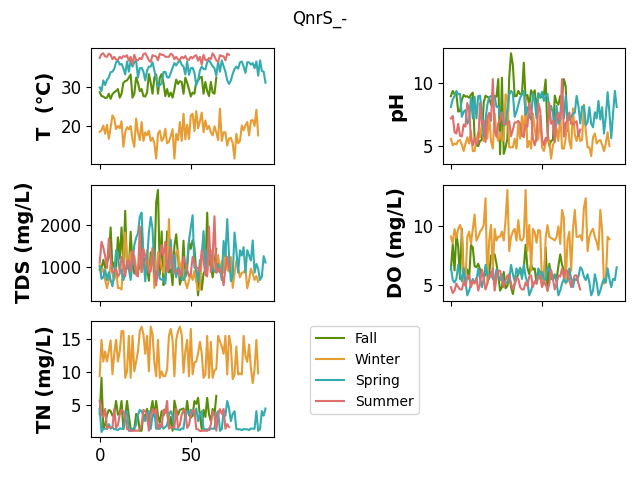
plot_boxplot(feature, '-', save=SAVE)
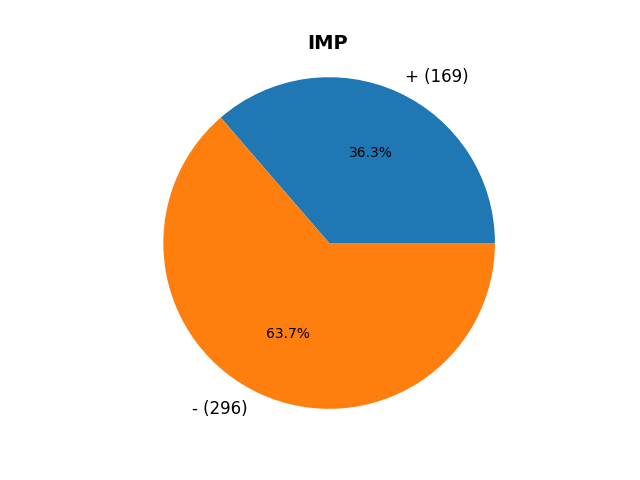
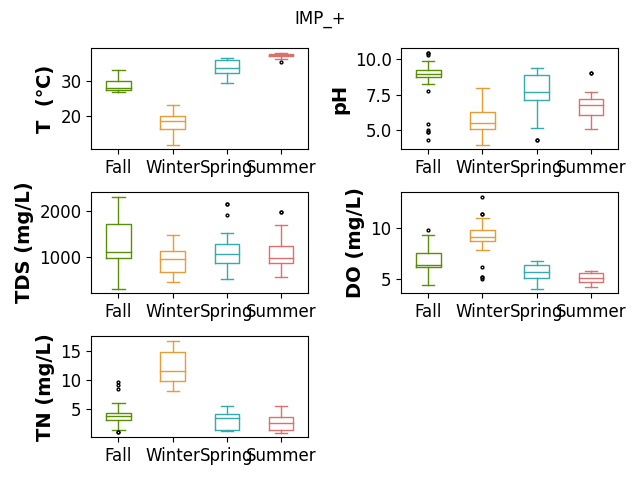
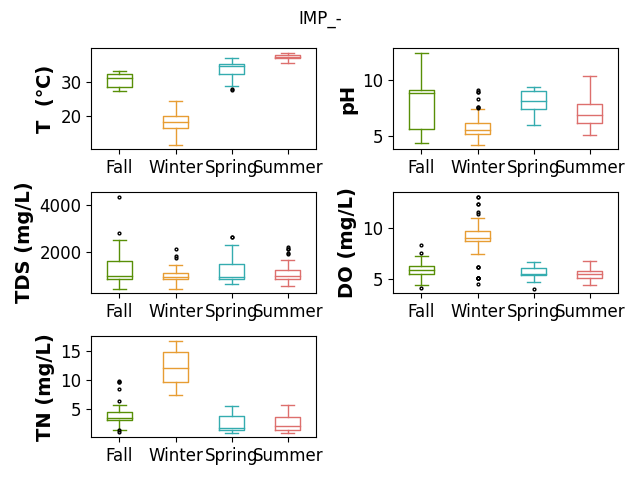
IMP
feature = 'IMP'

print(f'unique values in {feature}: {data[feature].unique()}')
unique values in IMP: ['+' '-' nan]
_ = pie(data[feature].dropna().values, ax_kws=dict(title=feature), show=False)
if SAVE:
    plt.savefig(f"results/figures/pie_{feature}.png", bbox_inches="tight", dpi=600)
plt.show()
plot_line(feature, '+', save=SAVE)
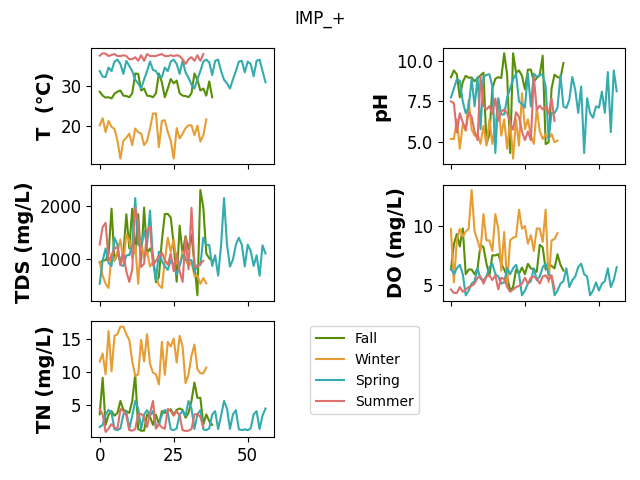
plot_boxplot(feature, '+', save=SAVE)
plot_line(feature, '-', save=SAVE)
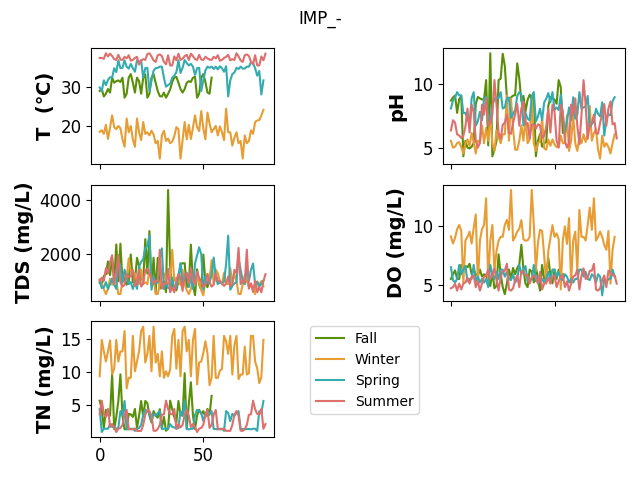
plot_boxplot(feature, '-', save=SAVE)
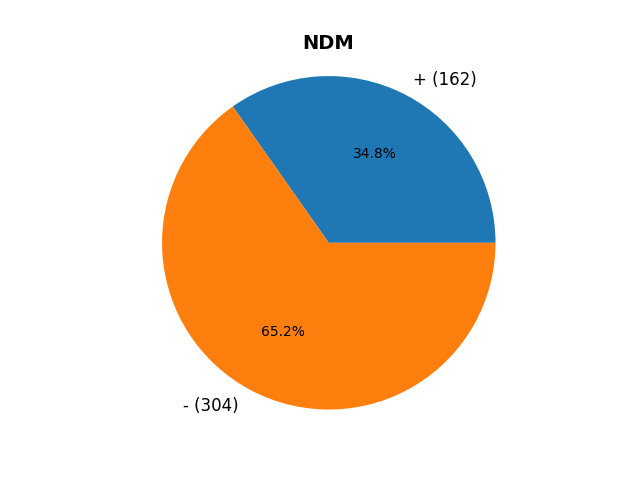
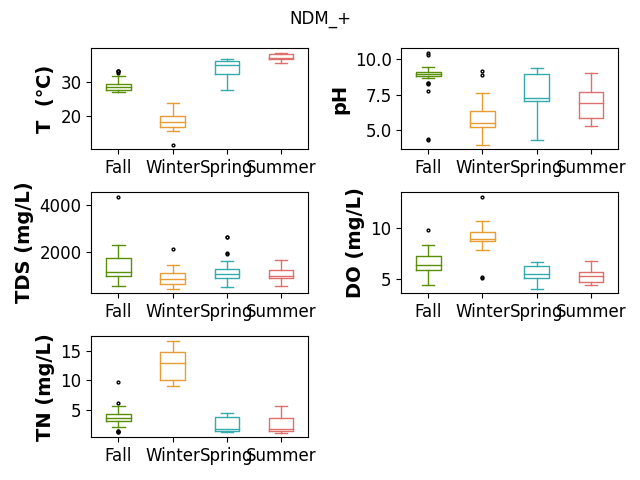
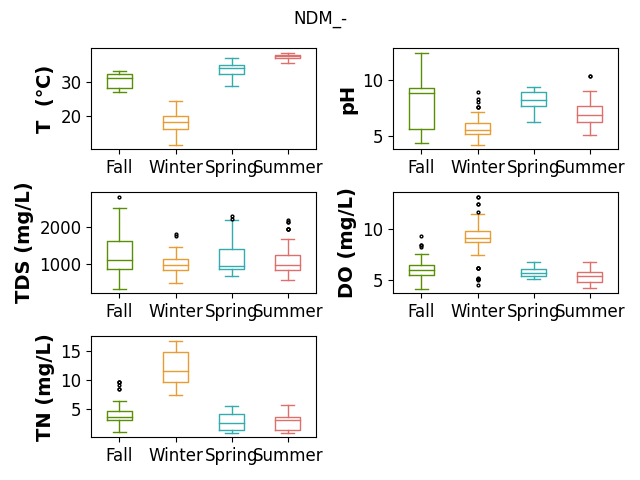
NDM
feature = 'NDM'

print(f'unique values in {feature}: {data[feature].unique()}')
unique values in NDM: ['+' '-']
_ = pie(data[feature].dropna().values, ax_kws=dict(title=feature),
        show=False)
if SAVE:
    plt.savefig(f"results/figures/pie_{feature}.png", bbox_inches="tight", dpi=600)
plt.show()
plot_line(feature, '+', save=SAVE)
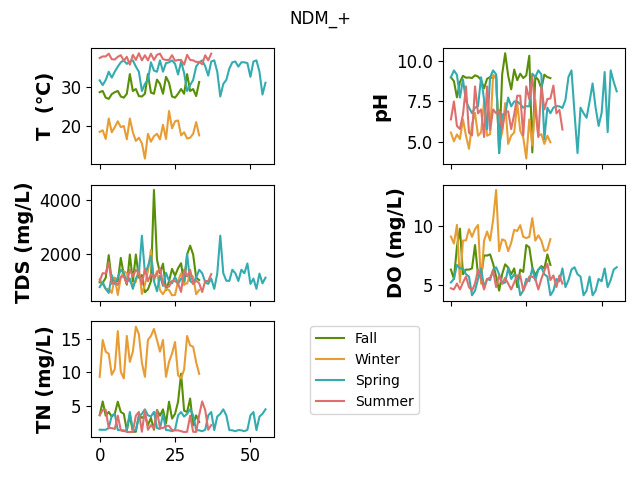
plot_boxplot(feature, '+', save=SAVE)
plot_line(feature, '-')
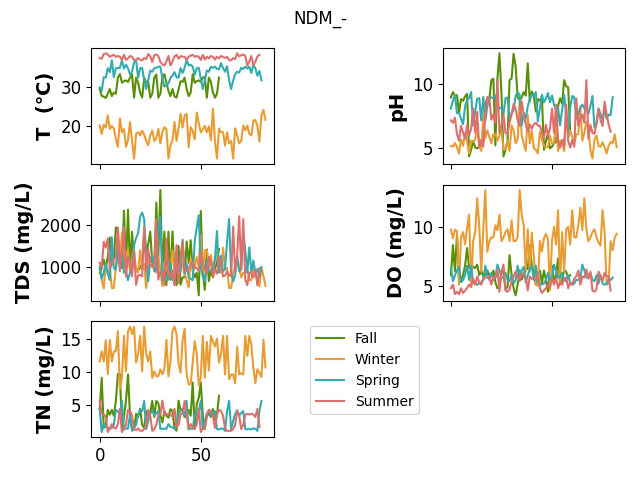
plot_boxplot(feature, '-', save=SAVE)
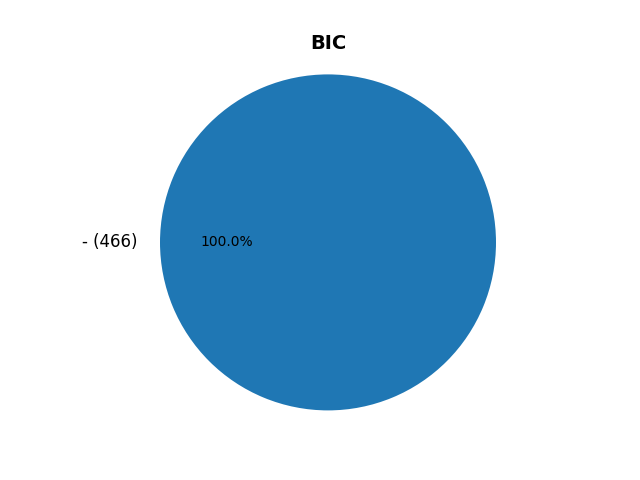
BIC
feature = 'BIC'

print(f'unique values in {feature}: {data[feature].unique()}')
unique values in BIC: ['-']
_ = pie(data[feature].dropna().values, ax_kws=dict(title=feature),
        show=False)
if SAVE:
    plt.savefig(f"results/figures/pie_{feature}.png", bbox_inches="tight", dpi=600)
plt.show()
plot_line(feature, '-', save=SAVE)

plot_boxplot(feature, '-', save=SAVE)

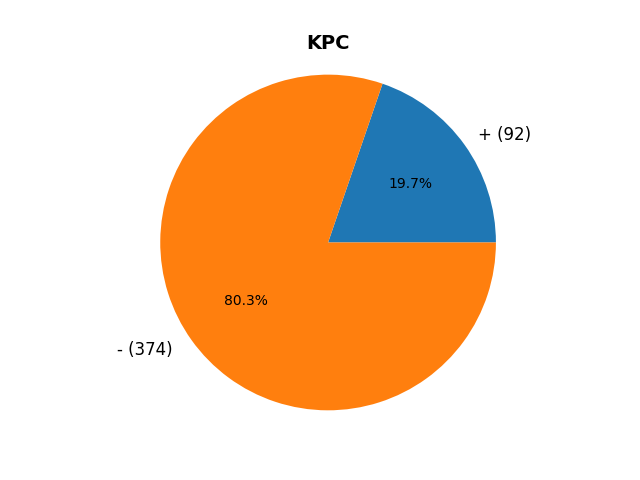
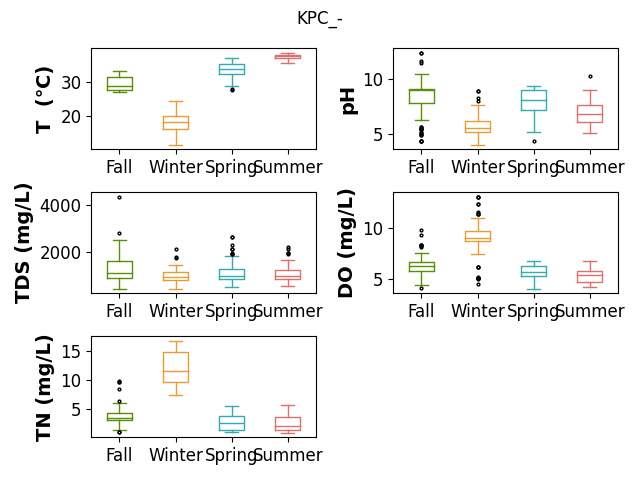
KPC
feature = 'KPC'

print(f'unique values in {feature}: {data[feature].unique()}')
unique values in KPC: ['-' '+']
_ = pie(data[feature].dropna().values, ax_kws=dict(title=feature), show=False)
if SAVE:
    plt.savefig(f"results/figures/pie_{feature}.png", bbox_inches="tight", dpi=600)
plt.show()
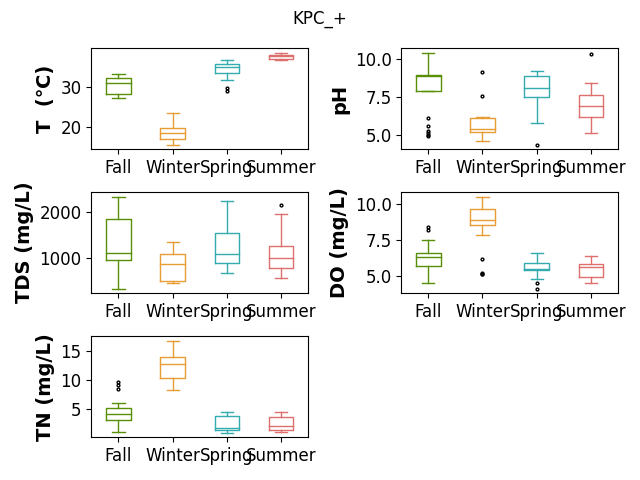
plot_line(feature, '+', save=SAVE)
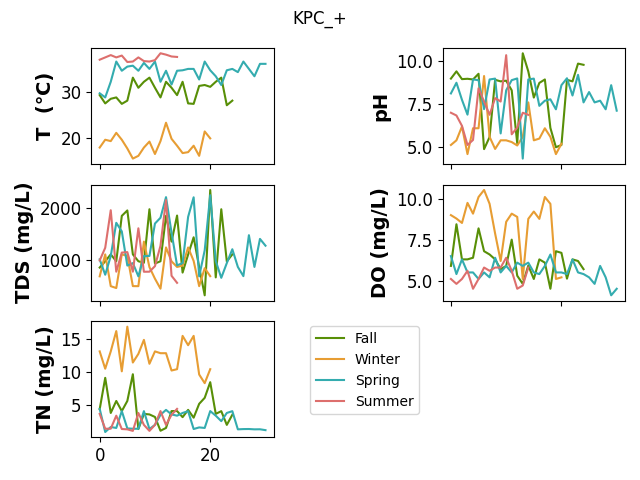
plot_boxplot(feature, '+', save=SAVE)
plot_line(feature, '-', save=SAVE)
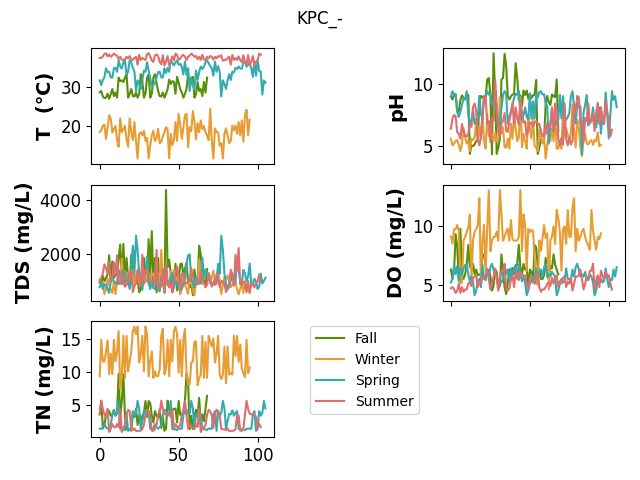
plot_boxplot(feature, '-', save=SAVE)
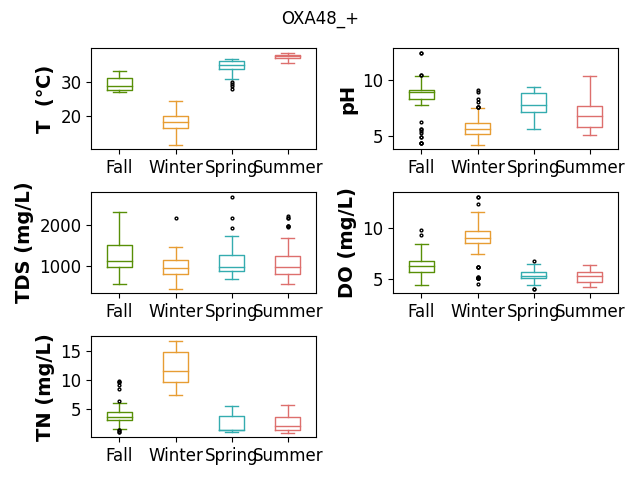
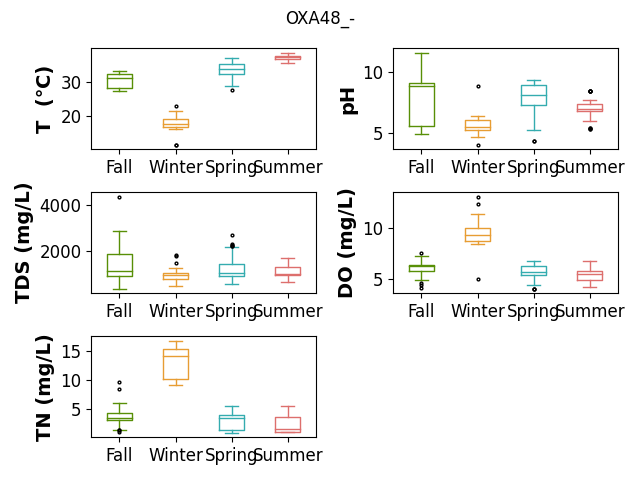
OXA48
feature = 'OXA48'

print(f'unique values in {feature}: {data[feature].unique()}')
unique values in OXA48: ['-' '+']
_ = pie(data[feature].dropna().values, ax_kws=dict(title=feature), show=False)
if SAVE:
    plt.savefig(f"results/figures/pie_{feature}.png", bbox_inches="tight", dpi=600)
plt.show()

plot_line(feature, '+', save=SAVE)
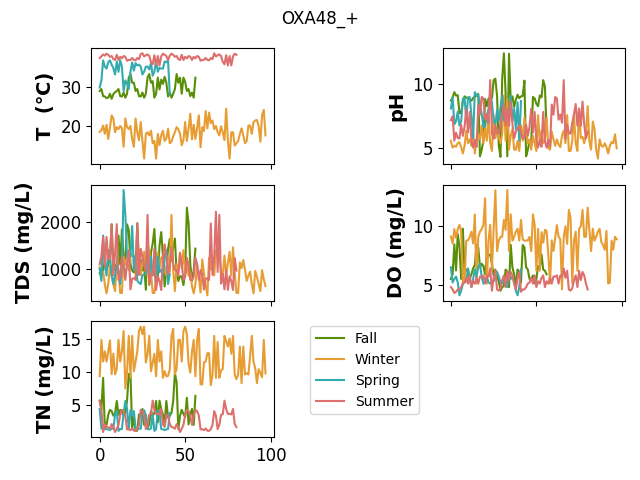
plot_boxplot(feature, '+', save=SAVE)
plot_line(feature, '-', save=SAVE)
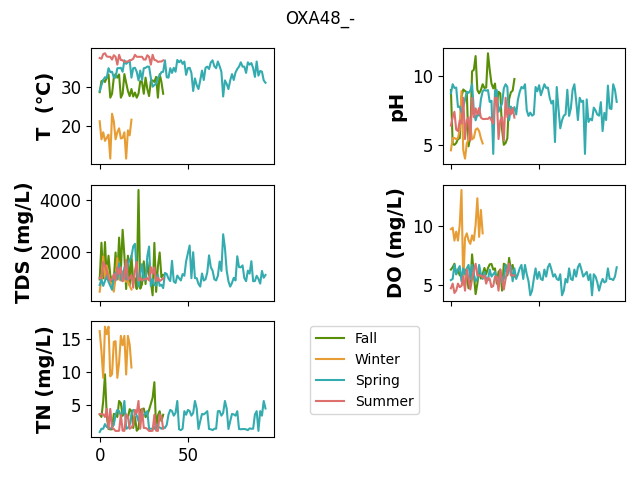
plot_boxplot(feature, '-', save=SAVE)
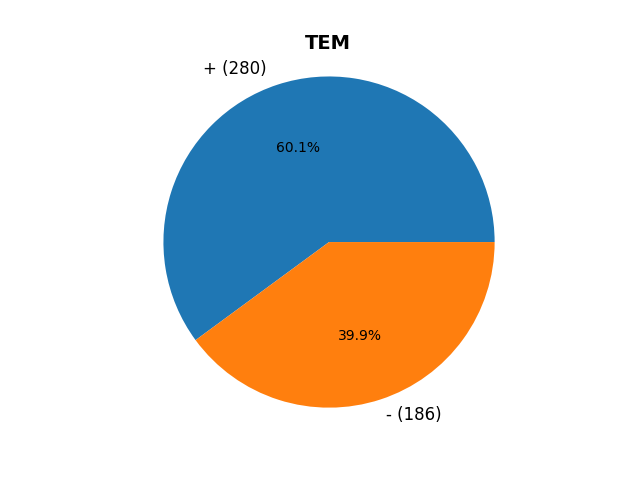
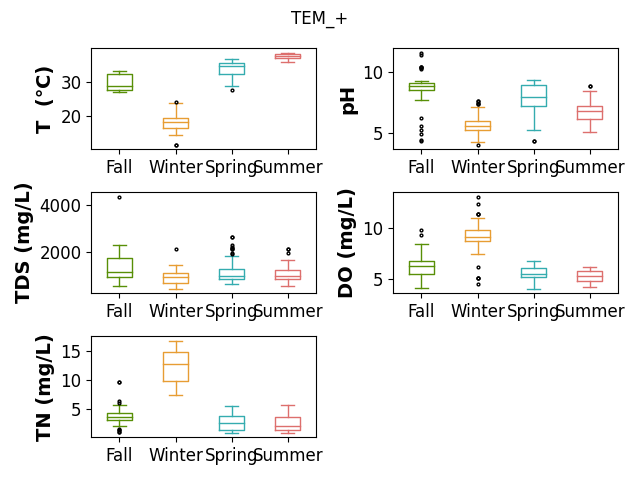
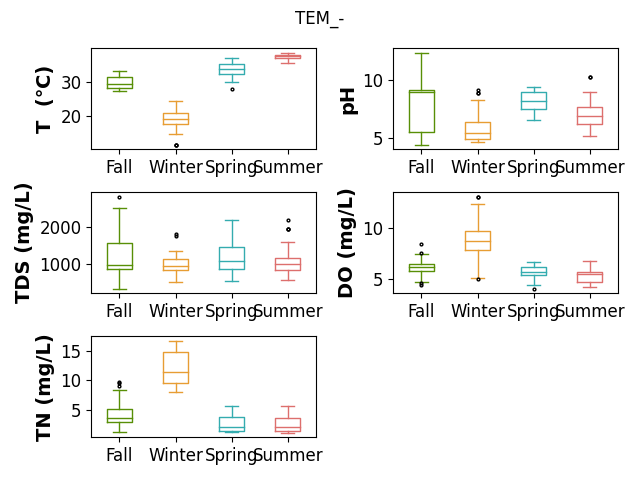
TEM
feature = 'TEM'

print(f'unique values in {feature}: {data[feature].unique()}')
unique values in TEM: ['+' '-']
_ = pie(data[feature].dropna().values, ax_kws=dict(title=feature), show=False)
if SAVE:
    plt.savefig(f"results/figures/pie_{feature}.png", bbox_inches="tight", dpi=600)
plt.show()
plot_line(feature, '+', save=SAVE)
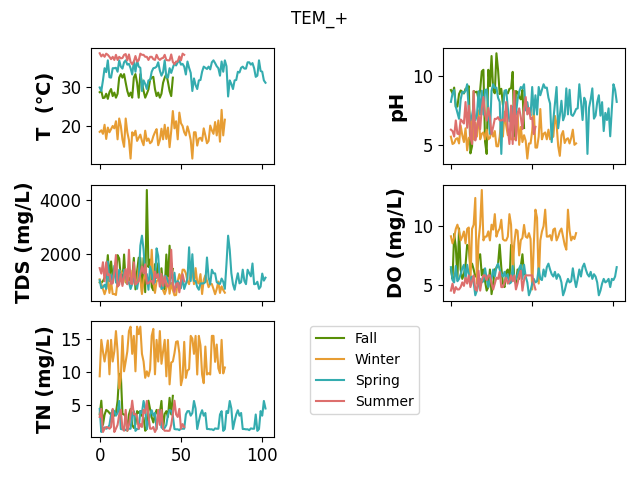
plot_boxplot(feature, '+', save=SAVE)
plot_line(feature, '-', save=SAVE)
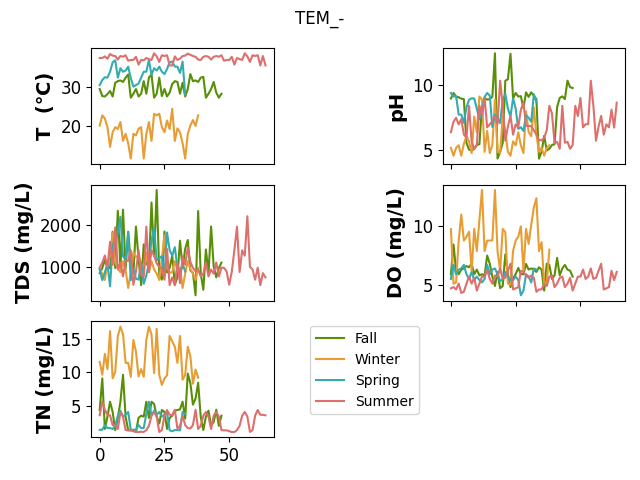
plot_boxplot(feature, '-', save=SAVE)
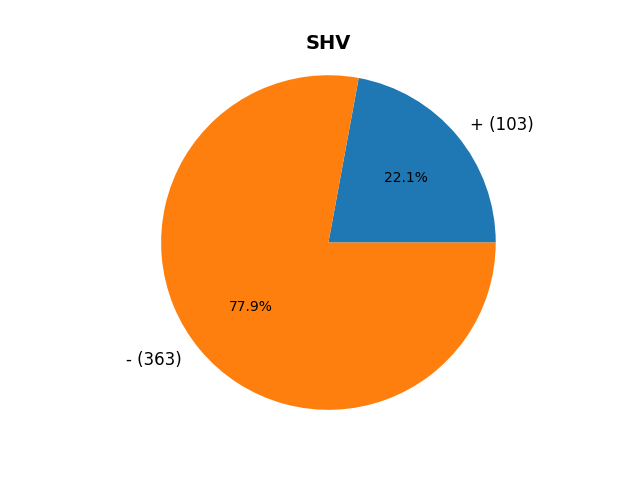
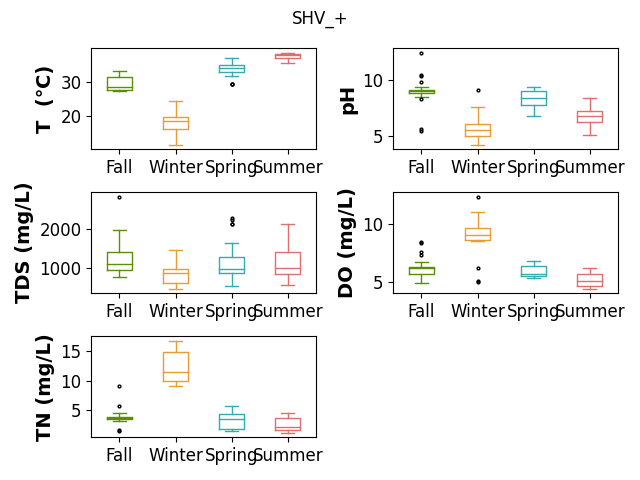
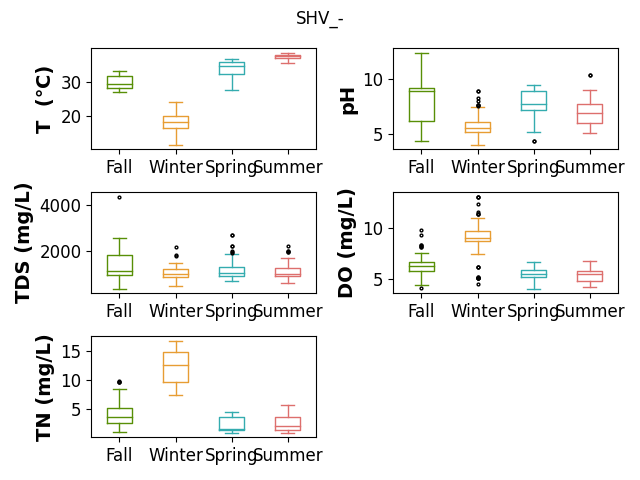
SHV
feature = 'SHV'

print(f'unique values in {feature}: {data[feature].unique()}')
unique values in SHV: ['-' '+']
_ = pie(data[feature].dropna().values, ax_kws=dict(title=feature), show=False)
if SAVE:
    plt.savefig(f"results/figures/pie_{feature}.png", bbox_inches="tight", dpi=600)
plt.show()
plot_line(feature, '+', save=SAVE)
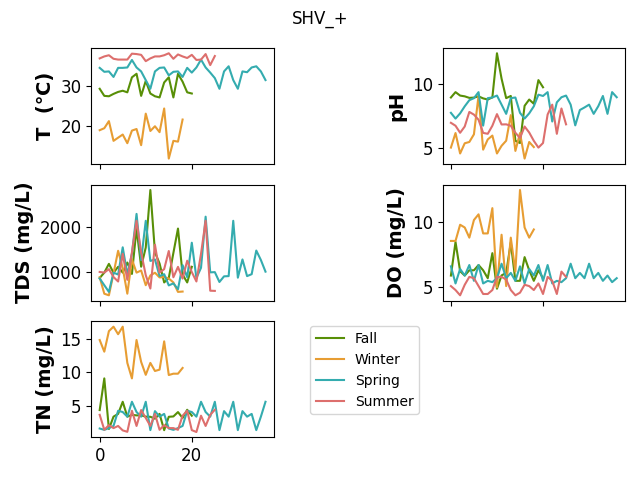
plot_boxplot(feature, '+', save=SAVE)
plot_line(feature, '-', save=SAVE)
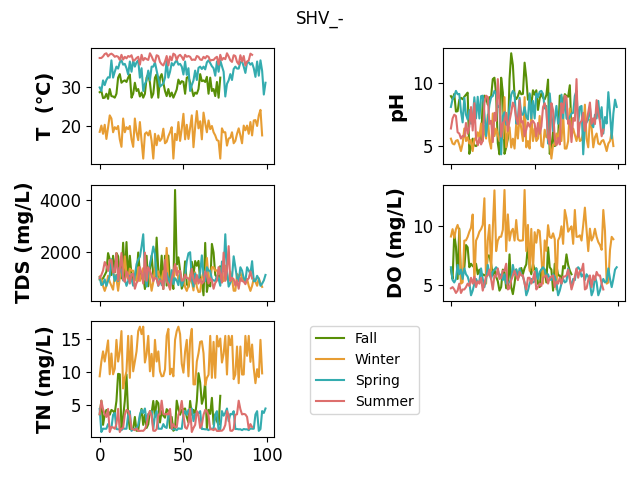
plot_boxplot(feature, '-', save=SAVE)
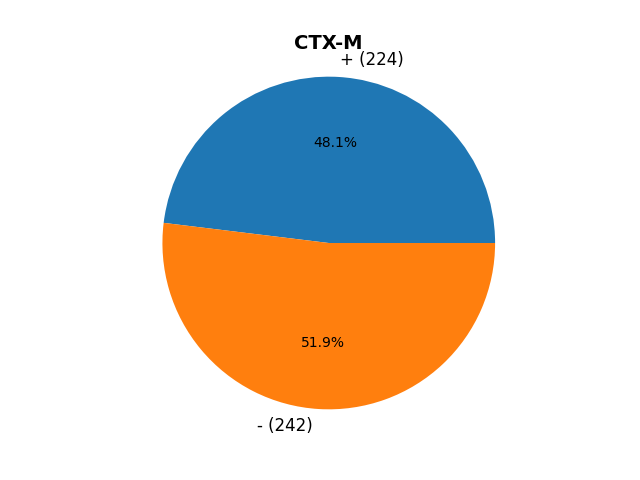
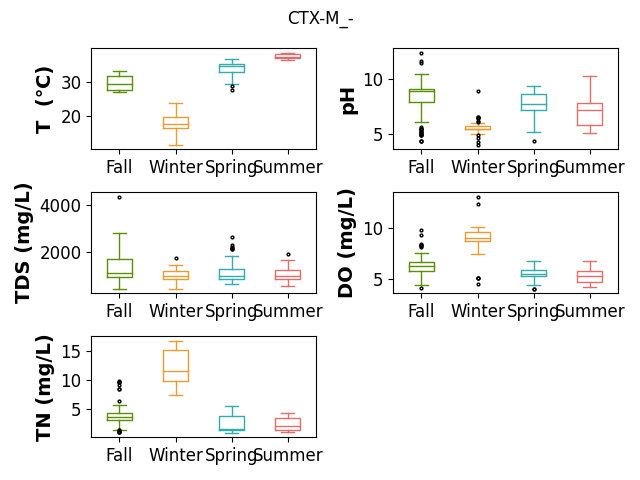
CTX-M
feature = 'CTX-M'

print(f'unique values in {feature}: {data[feature].unique()}')
unique values in CTX-M: ['+' '-']
_ = pie(data[feature].dropna().values, ax_kws=dict(title=feature), show=False)
if SAVE:
    plt.savefig(f"results/figures/pie_{feature}.png", bbox_inches="tight", dpi=600)
plt.show()
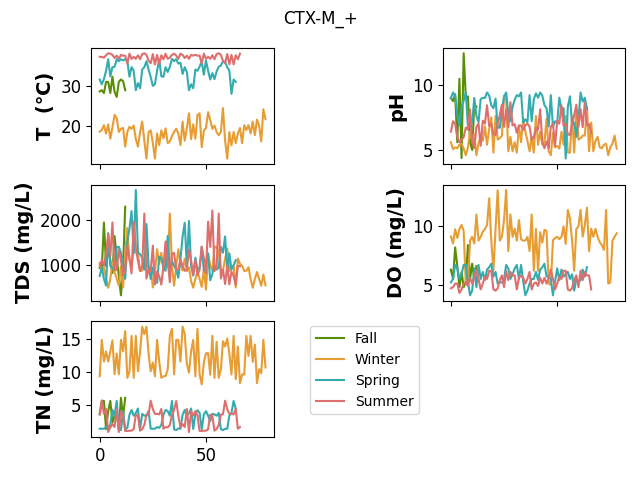
plot_line(feature, '+', save=SAVE)
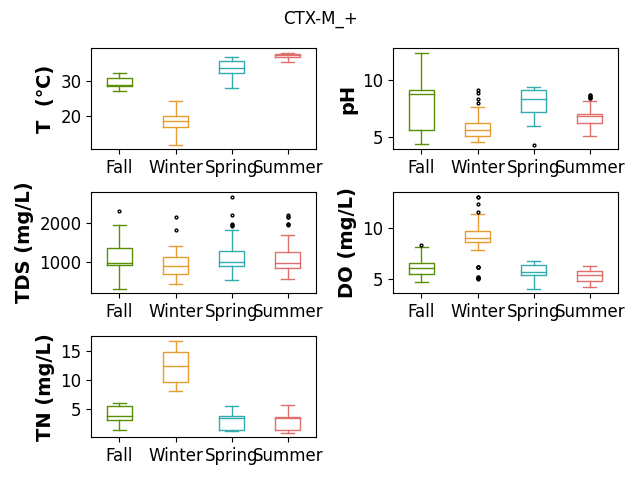
plot_boxplot(feature, '+', save=SAVE)
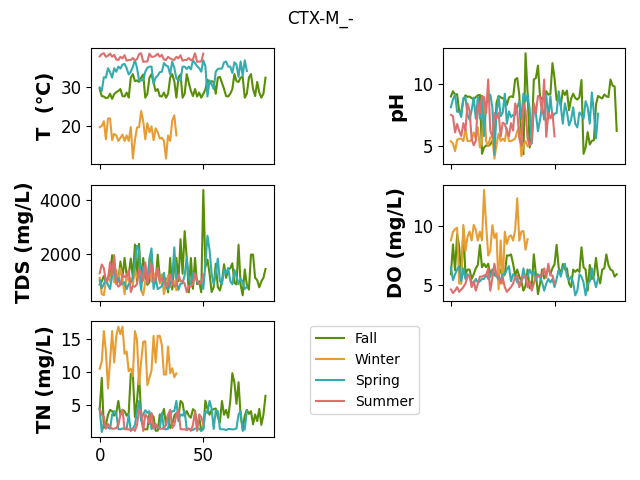
plot_line(feature, '-', save=SAVE)
plot_boxplot(feature, '-', save=SAVE)
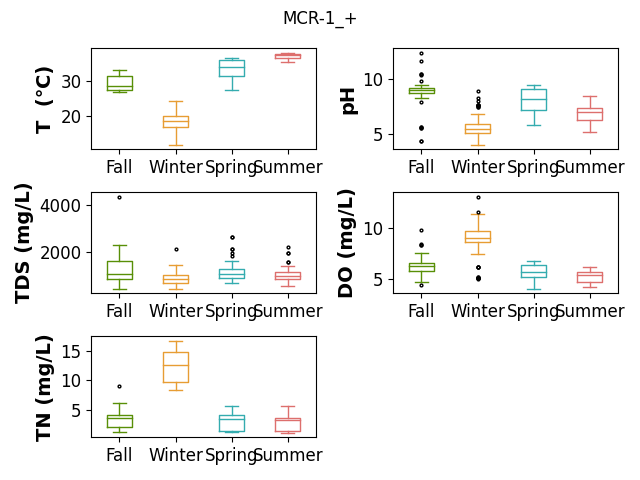
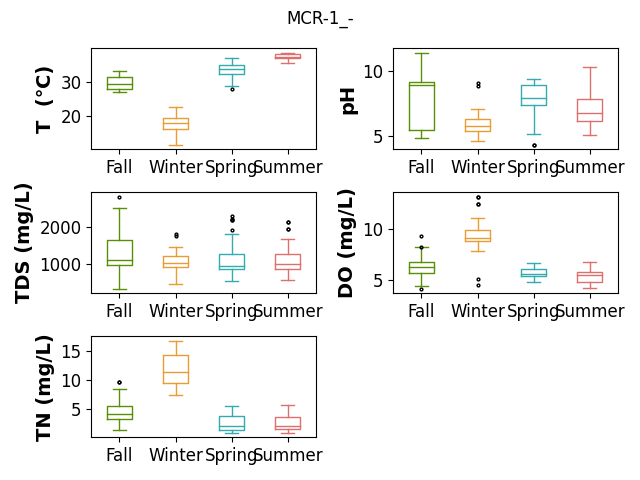
MCR-1
feature = 'MCR-1'

print(f'unique values in {feature}: {data[feature].unique()}')
unique values in MCR-1: ['+' '-' nan]
_ = pie(data[feature].dropna().values, ax_kws=dict(title=feature), show=False)
if SAVE:
    plt.savefig(f"results/figures/pie_{feature}.png", bbox_inches="tight", dpi=600)
plt.show()

plot_line(feature, '+', save=SAVE)
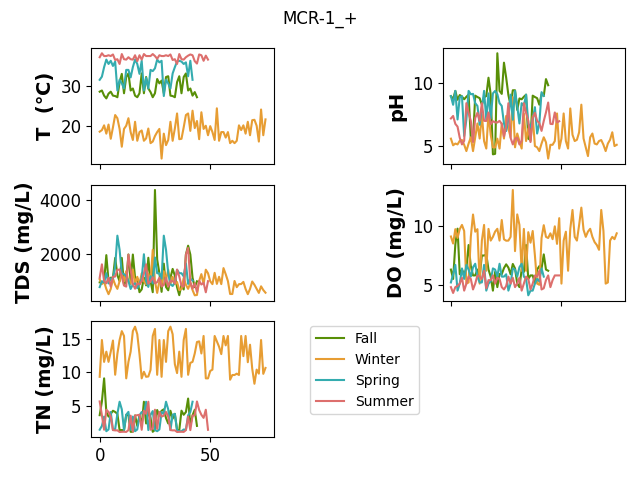
plot_boxplot(feature, '+', save=SAVE)
plot_line(feature, '-', save=SAVE)
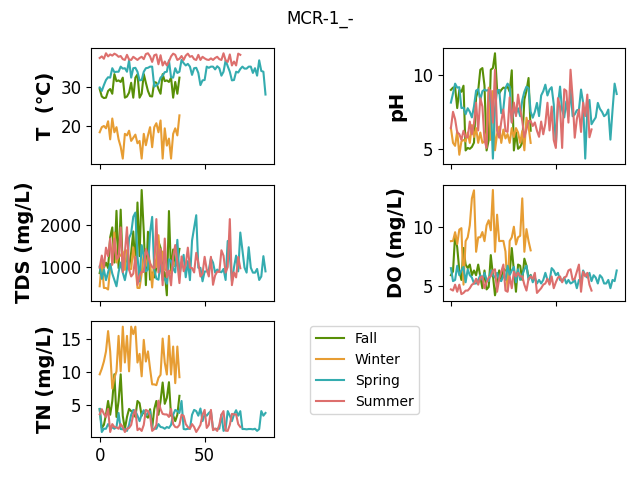
plot_boxplot(feature, '-', save=SAVE)
Total running time of the script: ( 4 minutes 44.328 seconds)